This thread has been locked.

If you have a related question, please click the "Ask a related question" button in the top right corner. The newly created question will be automatically linked to this question.

IWR6843AOPEVM: robotics lab number of detection points less than expected

Part Number: IWR6843AOPEVM
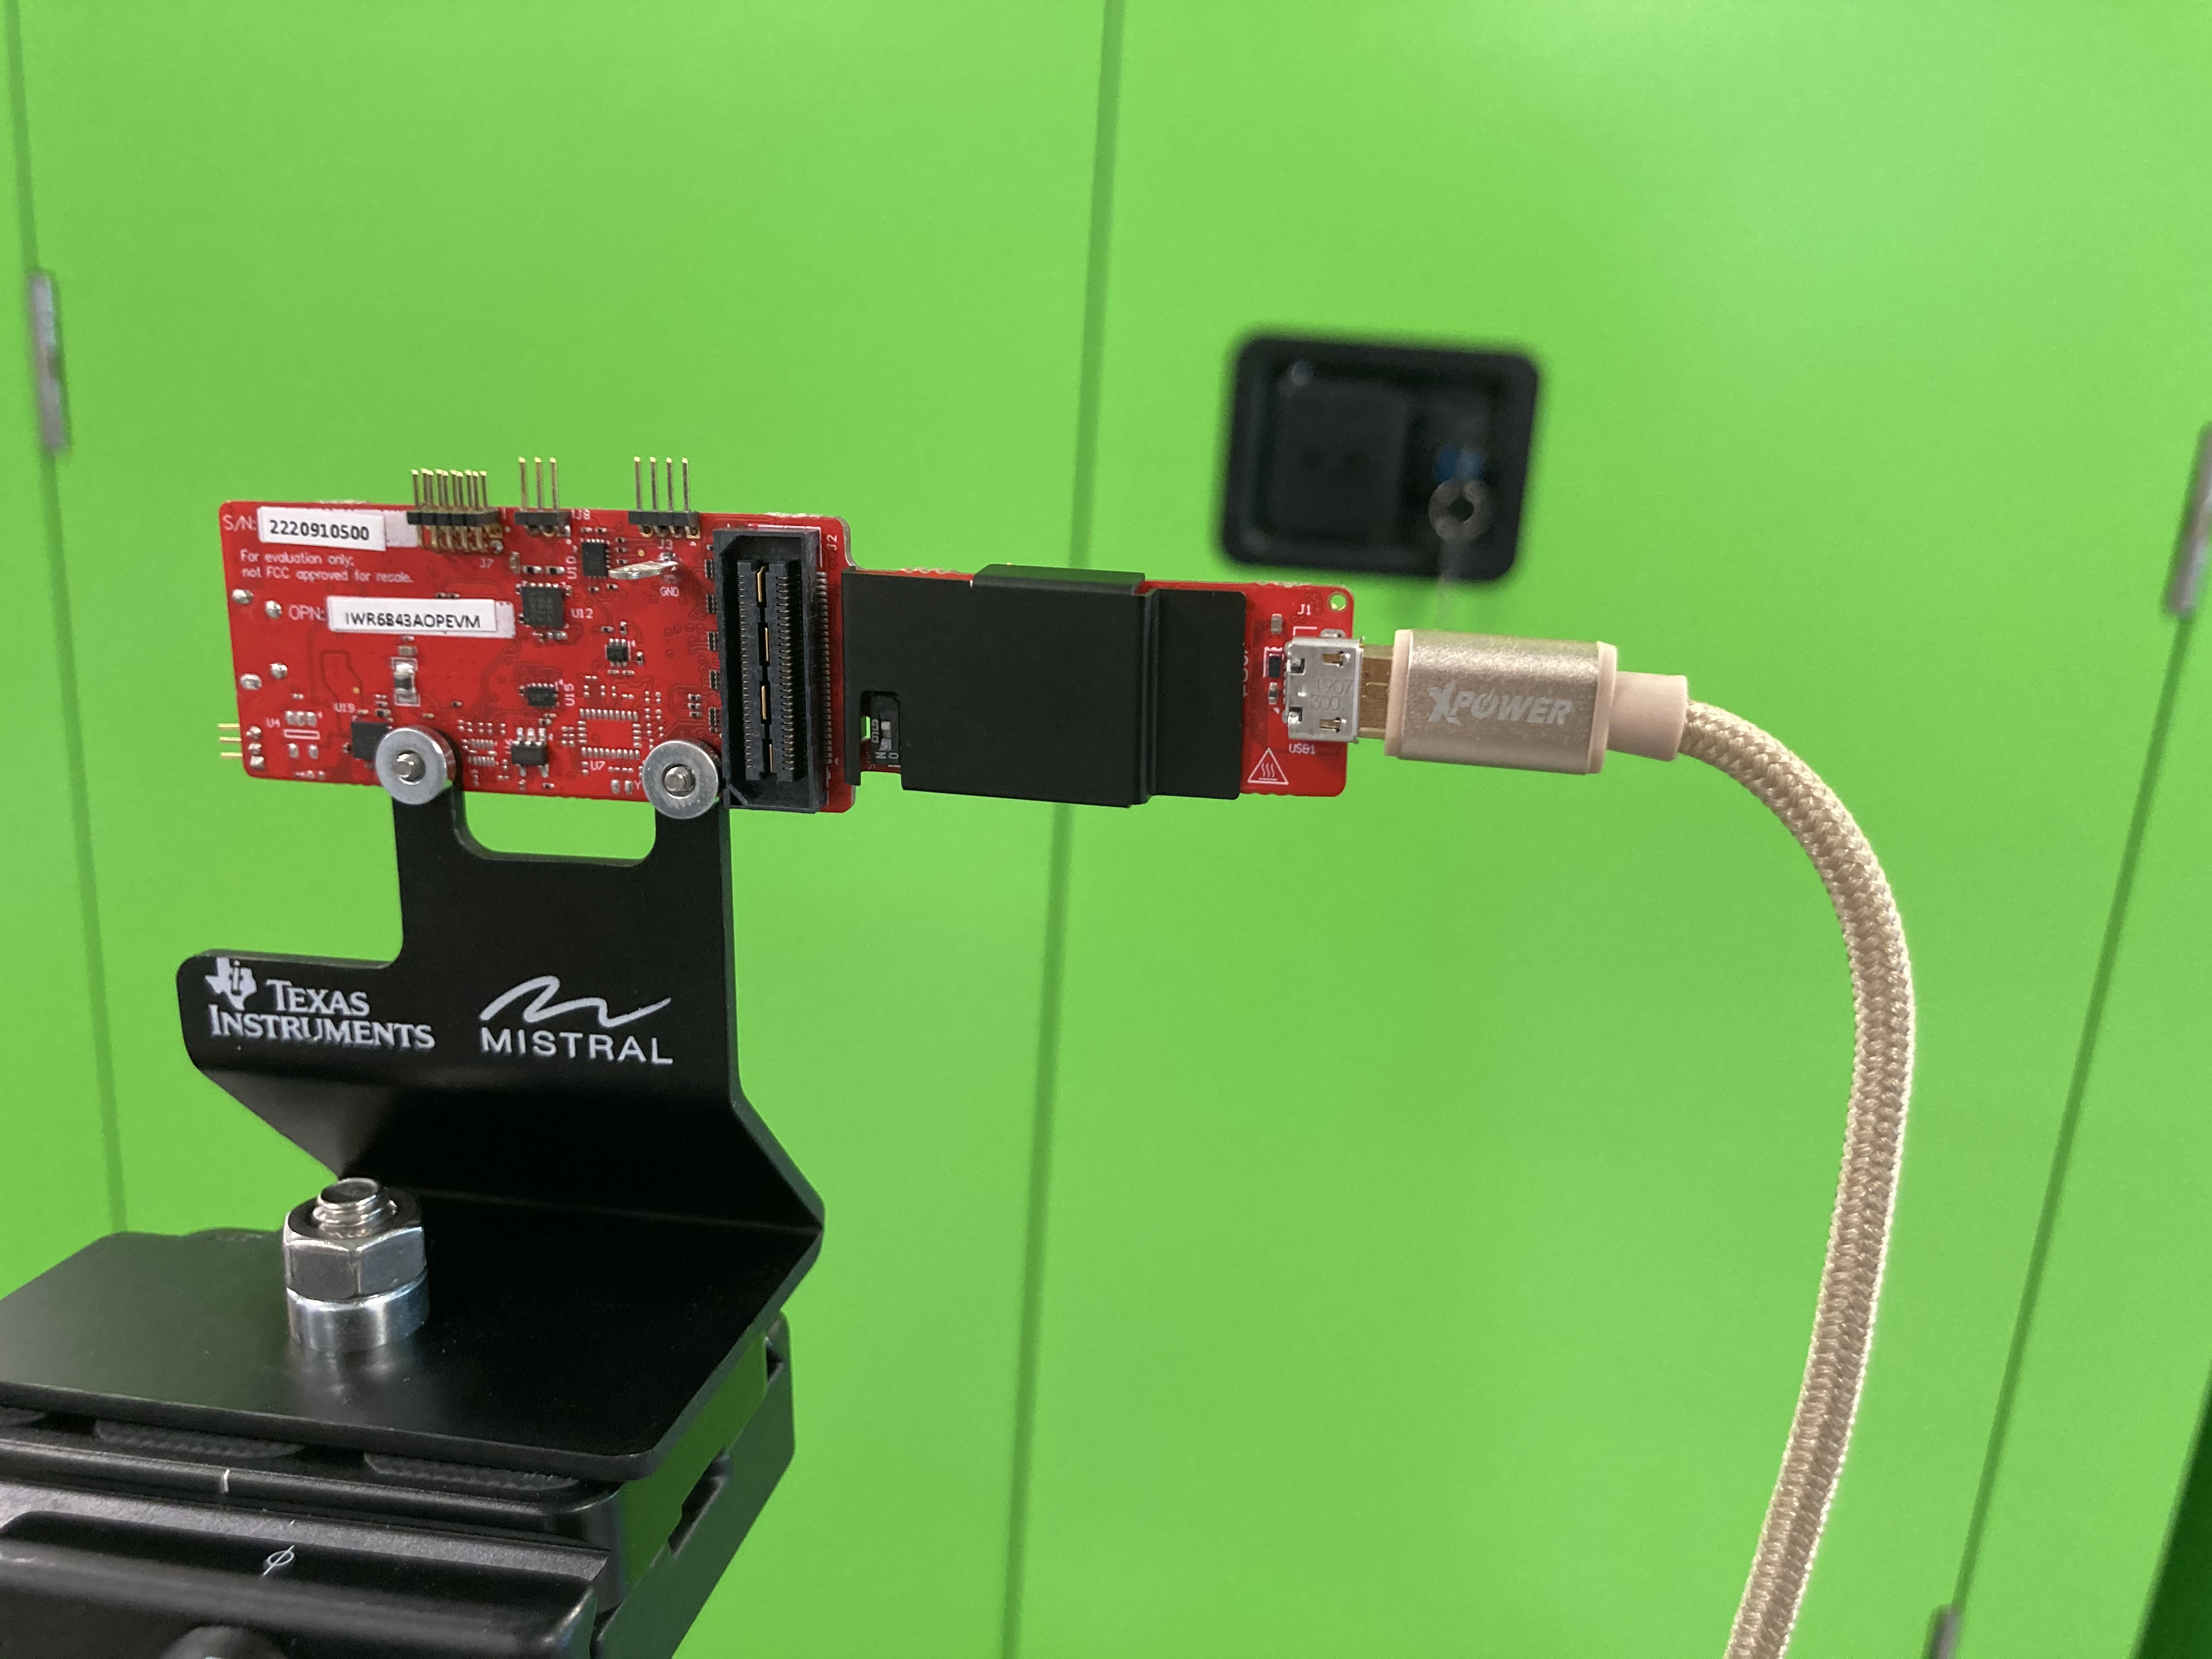
Other Parts Discussed in Thread: IWR6843

Hi, I am trying to partially reproduce the autonomous robotics lab under industrial toolbox.
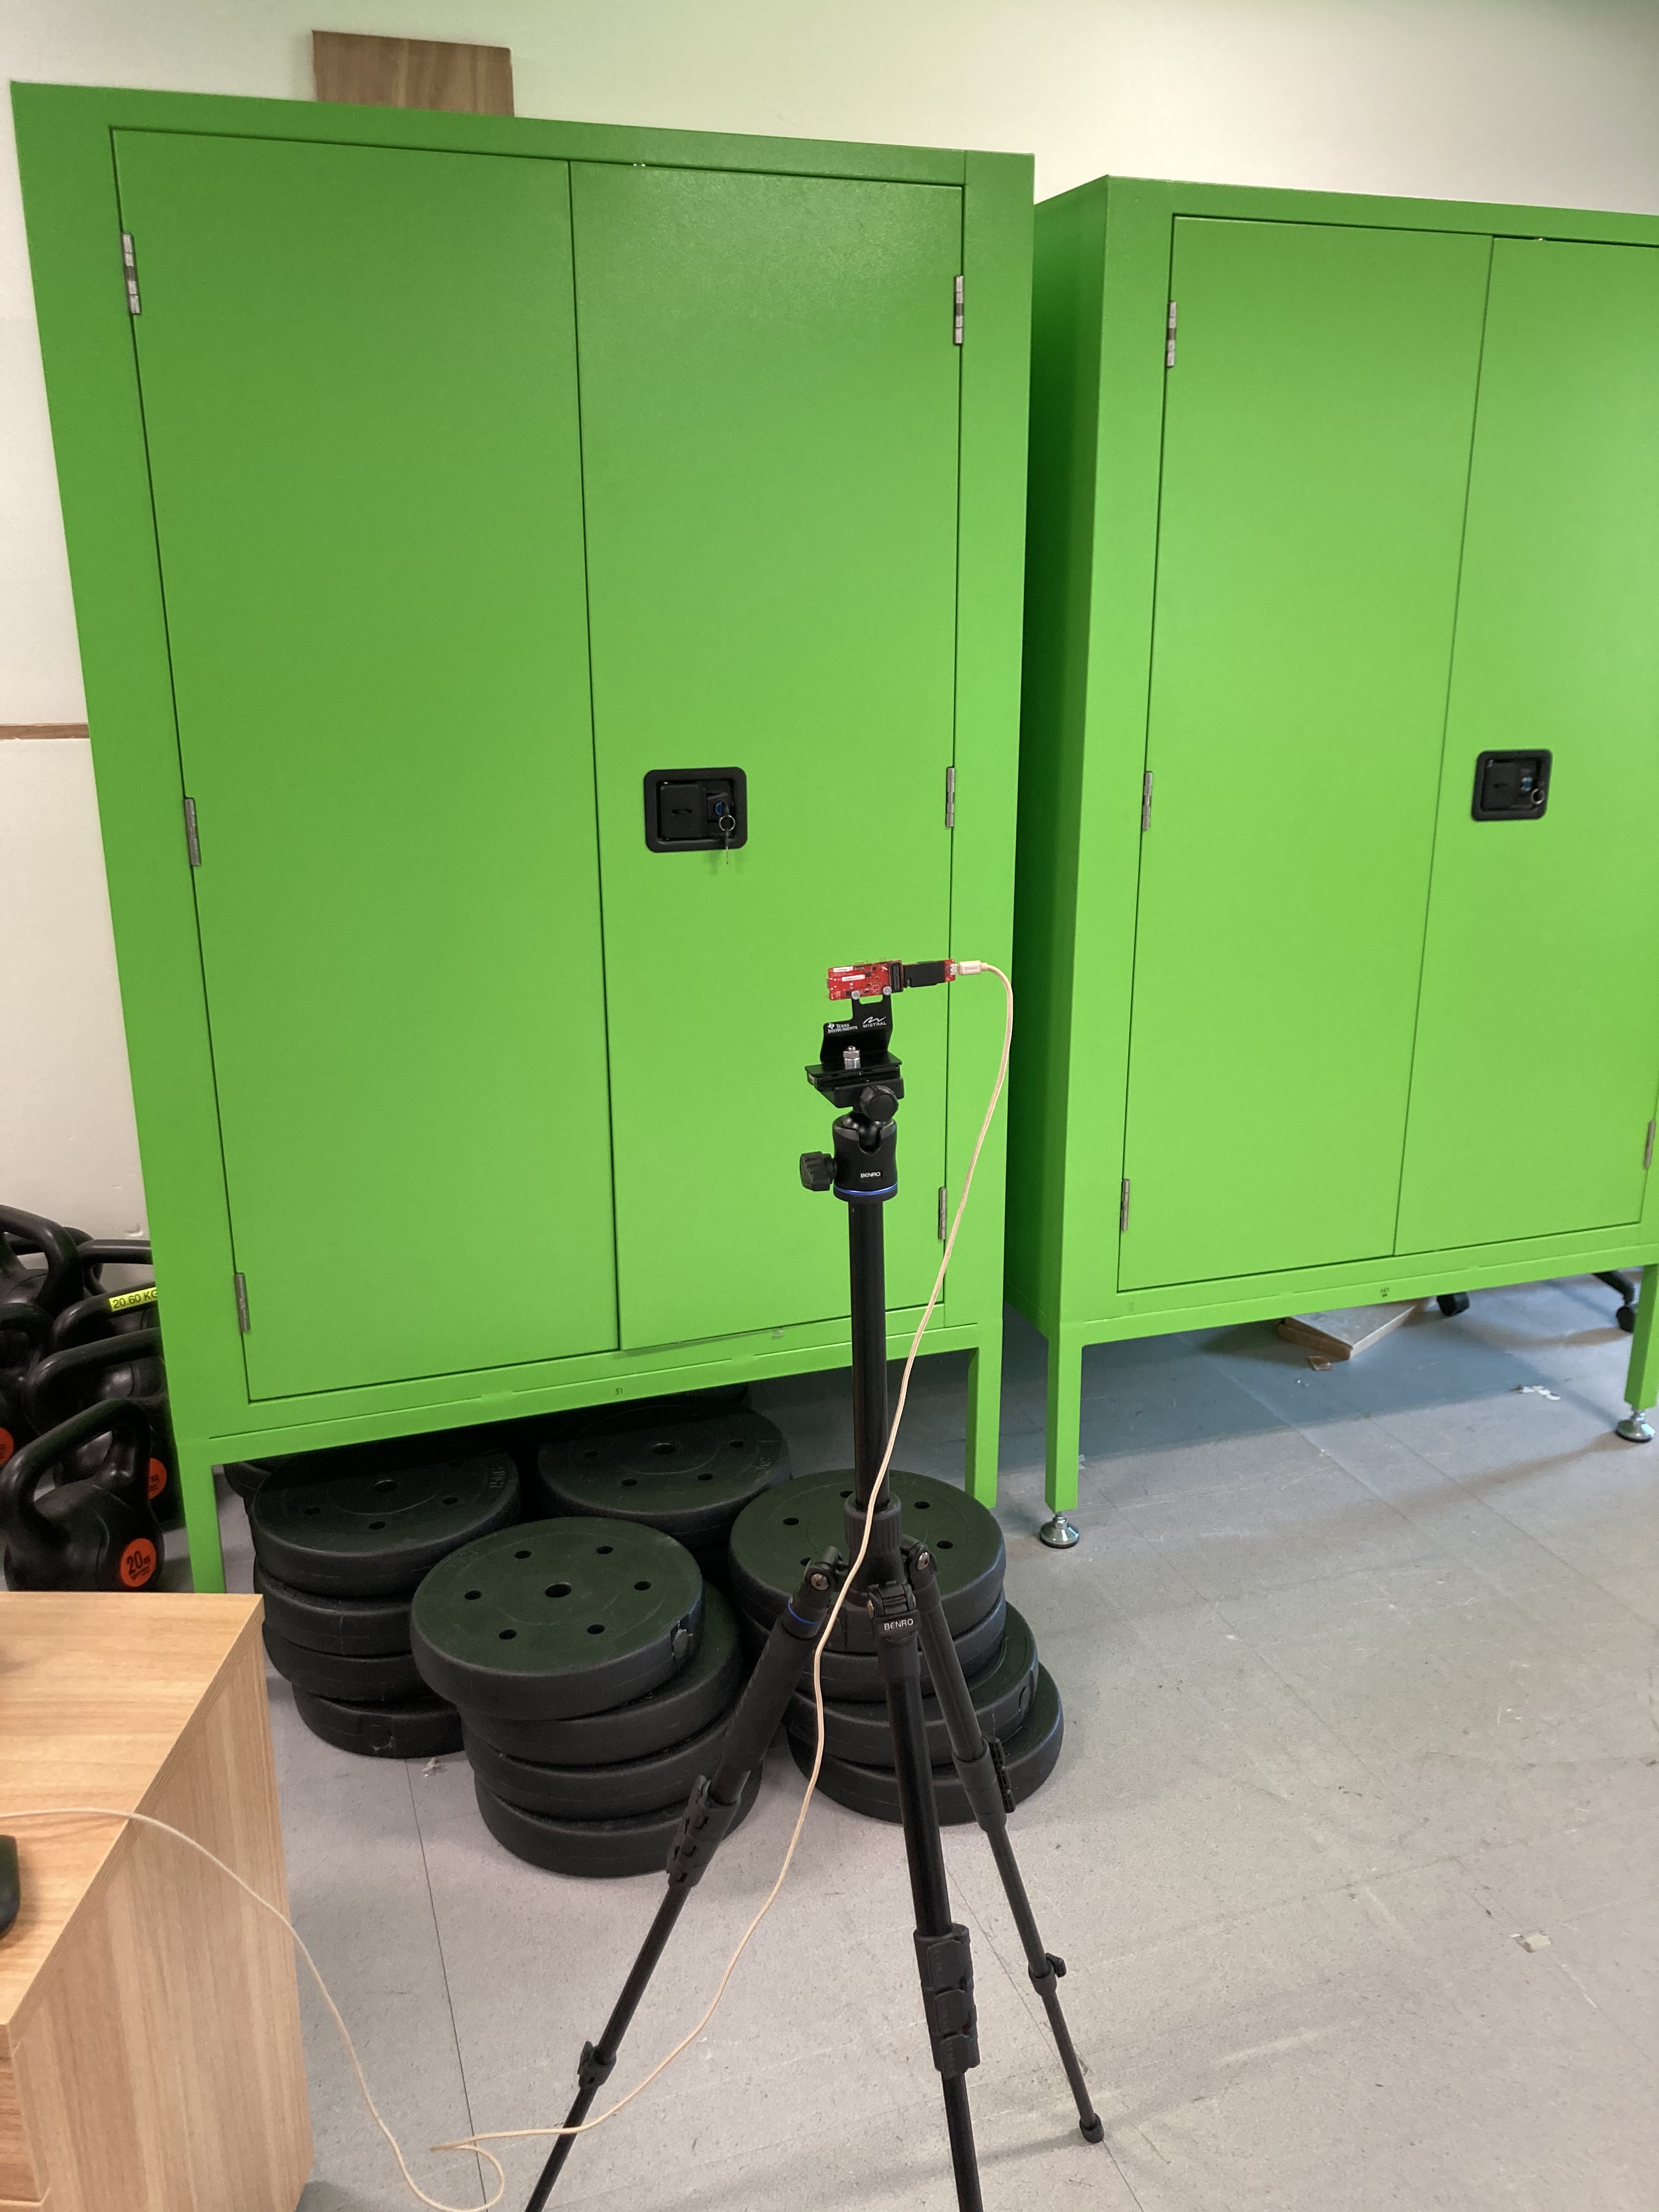
here is my setup:

using IWR6843AOPEVM, with the out-of-box demo. with the corresponding config loaded(copy from the autonomous robotics lab)

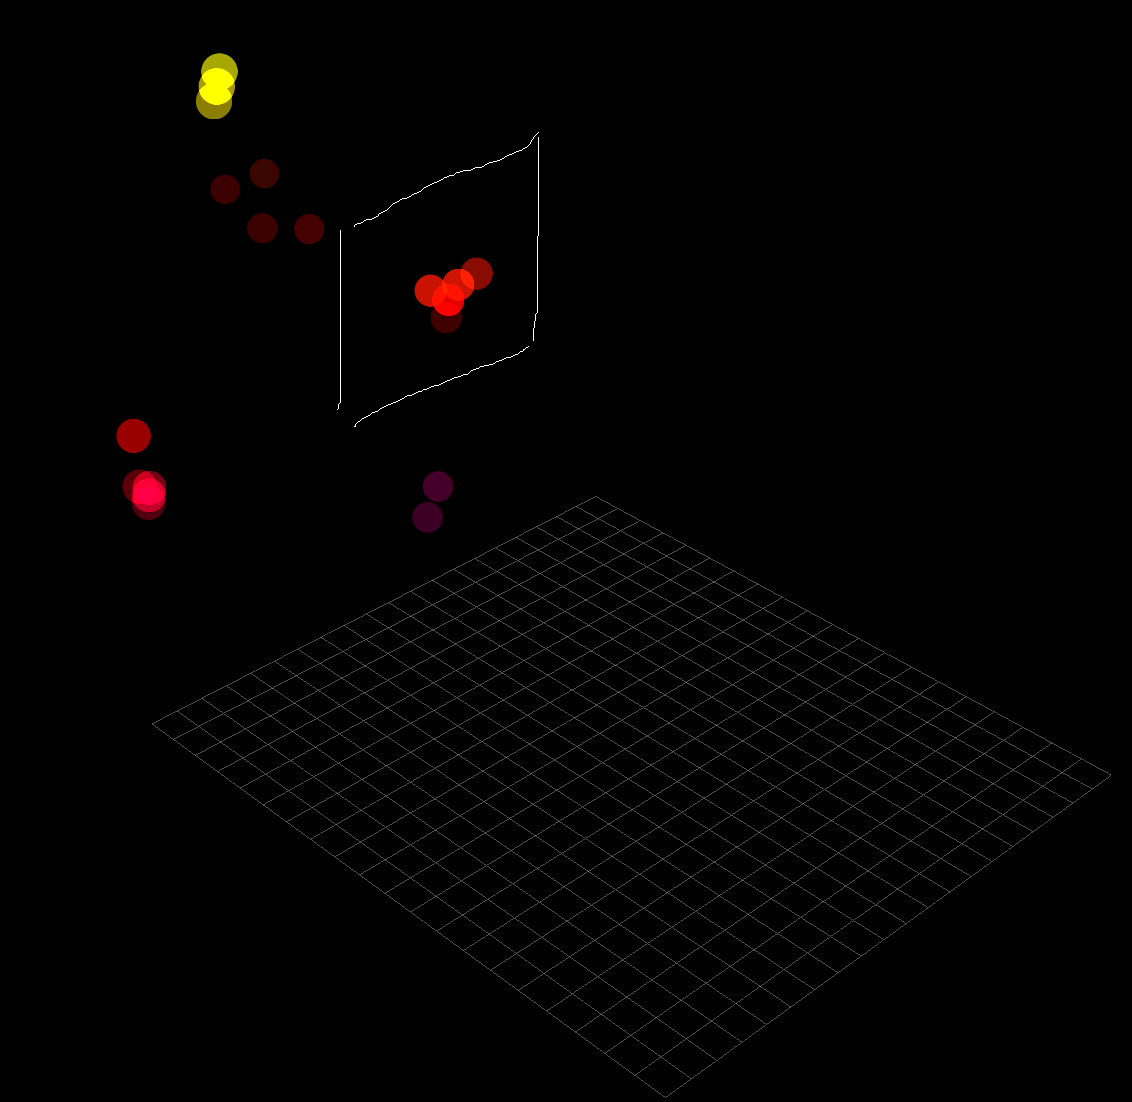
the experiment setup: pointing the radar towards a 2m x 1m metal surface. however, the detection result is not as good as expected. it only shows a few points (at least cannot tell it is a surface purely by looking at the points)

the hand-draw rectangle is the imaginary metal surface. and only a few points were inside the surface.

What can I do so that the detection points can be like a surface?

I have tried reduce the range direction CFAR threshold from 12dB to say 8dB. but that only give a few more points, still does not look a surface.

 6843AOP_3d.cfg

  • Hello,

    What is your expectation? Is it based on the clip you have pasted? Is your radar stationary? The point cloud would be more dense if the radar is moving. 

    Can you provide more details on your chirp configuration? What is your application?

  • Hi Sabeeh,

    Sorry that my description is not clear.

    My potential application would be obstacle avoidance, so I am interested the know the shape of the object based on the point cloud returned.

    My setup:

    dimension of the reflector (the front-side of green block): height: 1.65m, width: 1.2m

    distance from radar to reflector: 1.2m (experiment #1), 0.84m (experiment #2)

    and the reflector is in front of the radar.

    My expectation:

    In the gif given by TI in autonomous robotics lab, the resolution (I actually means distance between adjacent points)(at least vertically) is quite small. so I am expecting in my experiment, the point cloud returned from radar would be dense, spread over the reflector and able to be visually interpreted as a surface.

    The expectation above is purely based on the gif given from the lab.

    My result:

    see two gif below (big grey box: the reflector, the small grey box: the radar, the red point with various transparency: point cloud returned from radar)

    experiment #1

    experiment #2

    Observation from the two experiment:

    the returned point cloud mainly located in front of radar, but does not spread over the reflector (CANNOT even form a 20cm*20cm plane), which is not what I expected.

    Remark:

    1. I have also tried using floor, ceiling, wall as the reflector, and I still cannot get enough points to represent the reflector.

    2. I have also tried to do it with the radar moving slowly. the returned point cloud fluctuate, and I still cannot get enough points to represent the reflector .

    My config:

    % ***************************************************************
    % Created for SDK ver:03.02
    % Created using Visualizer ver:3.2.0.0_AOP
    % Frequency:60
    % Platform:xWR68xx_AOP
    % Scene Classifier:best_range_res
    % Azimuth Resolution(deg):30 + 30
    % Range Resolution(m):0.047
    % Maximum unambiguous Range(m):9.02
    % Maximum Radial Velocity(m/s):4.99
    % Radial velocity resolution(m/s):0.63
    % Frame Duration(msec):33.333
    % Range Detection Threshold (dB):15
    % Doppler Detection Threshold (dB):15
    % Range Peak Grouping:enabled
    % Doppler Peak Grouping:enabled
    % Static clutter removal:disabled
    % Angle of Arrival FoV: Full FoV
    % Range FoV: Full FoV
    % Doppler FoV: Full FoV
    % ***************************************************************
    sensorStop
    flushCfg
    dfeDataOutputMode 1
    channelCfg 15 7 0
    adcCfg 2 1
    adcbufCfg -1 0 1 1 1
    profileCfg 0 60 43 7 40 0 0 100 1 224 7000 0 0 30
    chirpCfg 0 0 0 0 0 0 0 1
    chirpCfg 1 1 0 0 0 0 0 2
    chirpCfg 2 2 0 0 0 0 0 4
    frameCfg 0 2 16 0 33.333 1 0
    lowPower 0 0
    guiMonitor -1 1 0 0 0 0 0
    cfarCfg -1 0 2 8 4 3 0 12 0
    cfarCfg -1 1 0 4 2 3 1 12 1
    multiObjBeamForming -1 1 0.5
    clutterRemoval -1 0
    calibDcRangeSig -1 0 -5 8 256
    extendedMaxVelocity -1 0
    lvdsStreamCfg -1 0 0 0
    compRangeBiasAndRxChanPhase 0.0 1 0 -1 0 1 0 -1 0 1 0 -1 0 1 0 -1 0 1 0 -1 0 1 0 -1 0
    measureRangeBiasAndRxChanPhase 0 1.5 0.2
    CQRxSatMonitor 0 3 4 99 0
    CQSigImgMonitor 0 111 4
    analogMonitor 0 0
    aoaFovCfg -1 -90 90 -90 90
    cfarFovCfg -1 0 0 8.40
    cfarFovCfg -1 1 -5.02 5.02
    sensorStart

    My question:

    Is the result in my experiment normal?

    How can I get more points that can be interpreted as a plane?


    hope the info above helps to clarify and thanks!

  • this is the azimuth-range heatmap. and it can somehow show the reflector (y=1.5, width = around 1.1m).
    Therefore, the problem of this post very likely is related to the filtering / detection algorithm, such as:
    1. peak grouping
    2. CFAR parameters
    3. multiObjBeamForming

    Please let me know if my thought is incorrect or anything missing...

  • Hi Ben,

    Let me take an action to discuss this internally. I will get back to you within 48 hours. 

  • Hi Ben, 

    I apologize, but I will need more time.

  • Hi Ben,

    Your expectations of the radar seem to be higher than what the radar can perform. The radar is very good at detecting objects, but providing size of the object as described in your experiment would be difficult due to the angular resolution of the radar. 

    I would urge you to have a look at our third party networks to see if what they offer may be of use to you; 


  • Hi Sabeeh,

    Thank you for the reply. I would like to ask some other questions which might help me to the understand problem of this post.

    From the training material, "range resolution" refers to the ability to resolve two closely spaced objects, and "range solution" can be calculated by: c/2B (c: speed of light, B: bandwidth).

    (this figure is capture from FMCW training material), at this figure, two peak can be separated and considered as two target, and the frequency bin is very small. From my understanding, the frequency axis can be transformed to range axis.

    At mmwave visualizer, I used IWR6843_AOP with B = 4GHz (60GHz - 64GHz) and the theoretical range solution is 0.0375m, I have no problem with this.


    However, the range separation between points at range profile is around 0.043m, which is much larger than what I expected. 0.043m is very close to "range solution (0.0375m in this case)". Then when two peak have separation of around 0.04m, since there would be no trough between two peaks, how can they be resolved? so I am wondering is the returned range profile down-sampled?

    I am also working on calculating the theoretical range separation between points at range profile by looking at the chirp receiver sampling rate and observation time. Is this the right direction?


  • HI Ben,

    This is not a ROS issue, so I'll have to close the thread. Please create a new thread, with a different topic and more information about your specific issue.