This thread has been locked.

If you have a related question, please click the "Ask a related question" button in the top right corner. The newly created question will be automatically linked to this question.

IWR1843: Target spectrum spread to nearby Range and Doppler bins in 2D FFT

Part Number: AWR1843
Other Parts Discussed in Thread: IWR1843

Hello,

      our team is using IWR1843 to develop out product, and we come across the problem of spectrum  spread: 

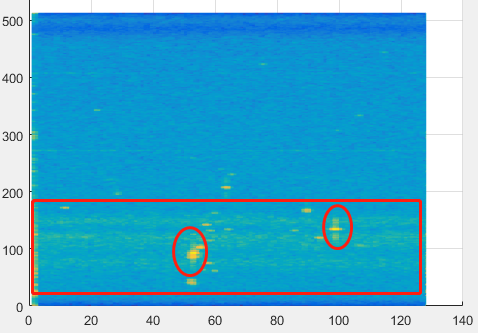
      when  real target is strong enough ,there will be two kinds of  spectrum  spreading in 2D FFT ,

     1)   the  nearby range bins will show flase spectrums  which is in the same Doppler bin with the real target ;

     2)  the  nearby range bins will show flase spectrums  which is in all  Doppler bins  ,this problem is exactly same as the related isues:

                e2e.ti.com/.../918494


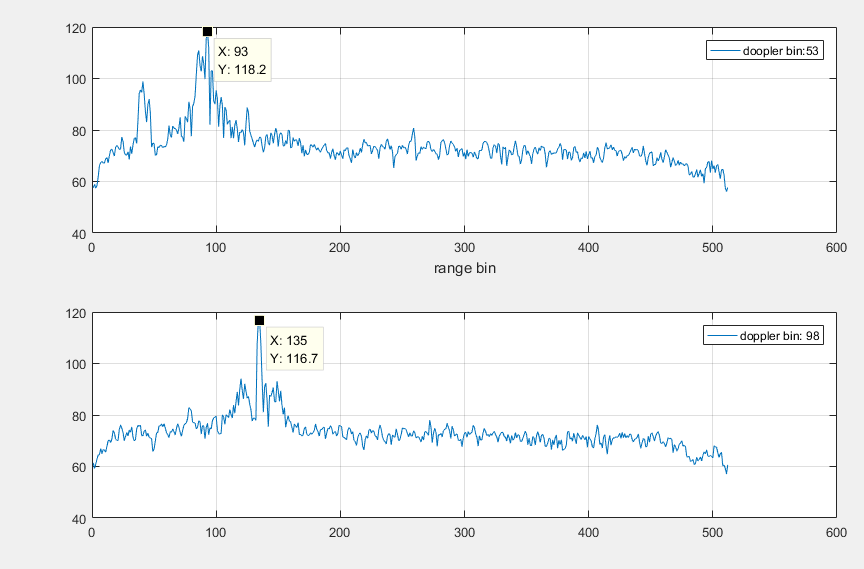
the two real target seats are (93,53),(134,98), their  power in 2D FFT is around 116dBm, 

parameters you may need :

             chrip end time is 50us,

            sampling rate is 12MHz, 1-complex,

            Rx_gain  is 44dB,

            ADC bit is 16bits,

            ADC  samples  numbers is 512,

            chirp num is 128, 

question:

   1) when target power beyond 110dBm in 2D FFT ,the  spectrum  spreading problem happens frequetly,   is LNA saturated?

    2) based on parameter above, I calculate target  input power  on the ADC  = 116dBm - 20*log10(32768) - 20*log10(512)--20l*og10(128) =   -70dBm, am I right? 

    3) how can I solve this problem?

  • HI, Cheng:

    Can you explain how did you get this data?  Are you using SDK OOB demo? or post processing from the raw data?

    Is the figure you shown above are range-Doppler heatmap? 

    Can you describe the test scene?   

    How did you calculated the input power is 116dBm? 

    Best,

    Zigang

  • Hi, Zigang:

       1)  we design our own radar  hardware using iwr1843, we  don't use the OOB demo, we design the  chirp parameters which I mentioned before,we  use the LVDS interface to get the raw data form our  hardware.

       2) yes , the figure is 2D FFT result of raw data by matlab ,the raw data has been added hanning window before FFT, 

              range size is 512, and doppler size is 128.

       3)  the test scene is traffic monitoring,we install the radar on the footbridge,and the targets are oncomming.

       4) the 2D FFT  result is showing in 20*log10() , I can see the target power  in the  range-Doppler heatmap  is about 116dBm,

            as I know,ADC_gain is about 90dB, range FFT gain is about 54dB, doppler  FFT gain is about 42dB, 

             so the target power at ADC is about -70dBm ? 


         Thanks ,

          Cheng


  • HI, Cheng:

    The heatmap is hard for me to see the signal dynamic.  Can you just use plot() function to show the 2D FFT output, with x-axis on range bin and different curve for different Doppler bin?  And can you also mark the main targets in the same figure?   Because it is hard for me to know the ground truth of your scene.   

    Regarding your target power at ADC, only you know all your scales in operation, I can not comment on that.  But you may have miss a step, knowing your dBfs at the ADC, you still need to convert to dBm.  You can refer to this following e2e thread: e2e.ti.com/.../659414

    Best,

    Zigang

  • HI,Zigang:

        1) Sorry, I didn't make it clear,hope this figure can describe the problem clearly:


        2)  I check the  thread you mentioned, I am clear about the the  ADC dBm  now, thank you.


    Best Regards,

    Cheng


  • HI, Cheng:

    What you circled in the last figure looks like a phase noise to me. 

    Best,

    Zigang

  • HI,Zigang:

            Do you mean that the phase noise of this hardware is poor, which leads to the spectrum glitch around real target?

           What factors affect the phase noise, such as power supply ripple? 

           do you have any advice  for the problem?

           thank you,

           Cheng

  • HI, Cheng:

    I would rather say the phase noise of close-in high reflection can cause noise shaping.  When I say noise shaping, I mean the red circle in your figure below, but not the high glitch in black circle below. 

    The phase noise is coming from the LO phase noise.  The LO phase noise level is given in the device data sheet.  Actually our devices have very good performance in terms of phase noise level.  The phase noise will be convolutional to the signal part in frequency domain (after range FFT).  So any signal will have the phase noise like a skirt around it, but it can be low and below the thermal noise. 

    The below signal looks very clouded, and it is very hard for me to understand.   Are those high glitch (in black circle)  are part of the target?  To evaluate the system performance, I would suggest you to measure in a low clutter and simple target (for example a corner reflector) scenario and then I can help to analyze your test results. 

    Best,

    Zigang