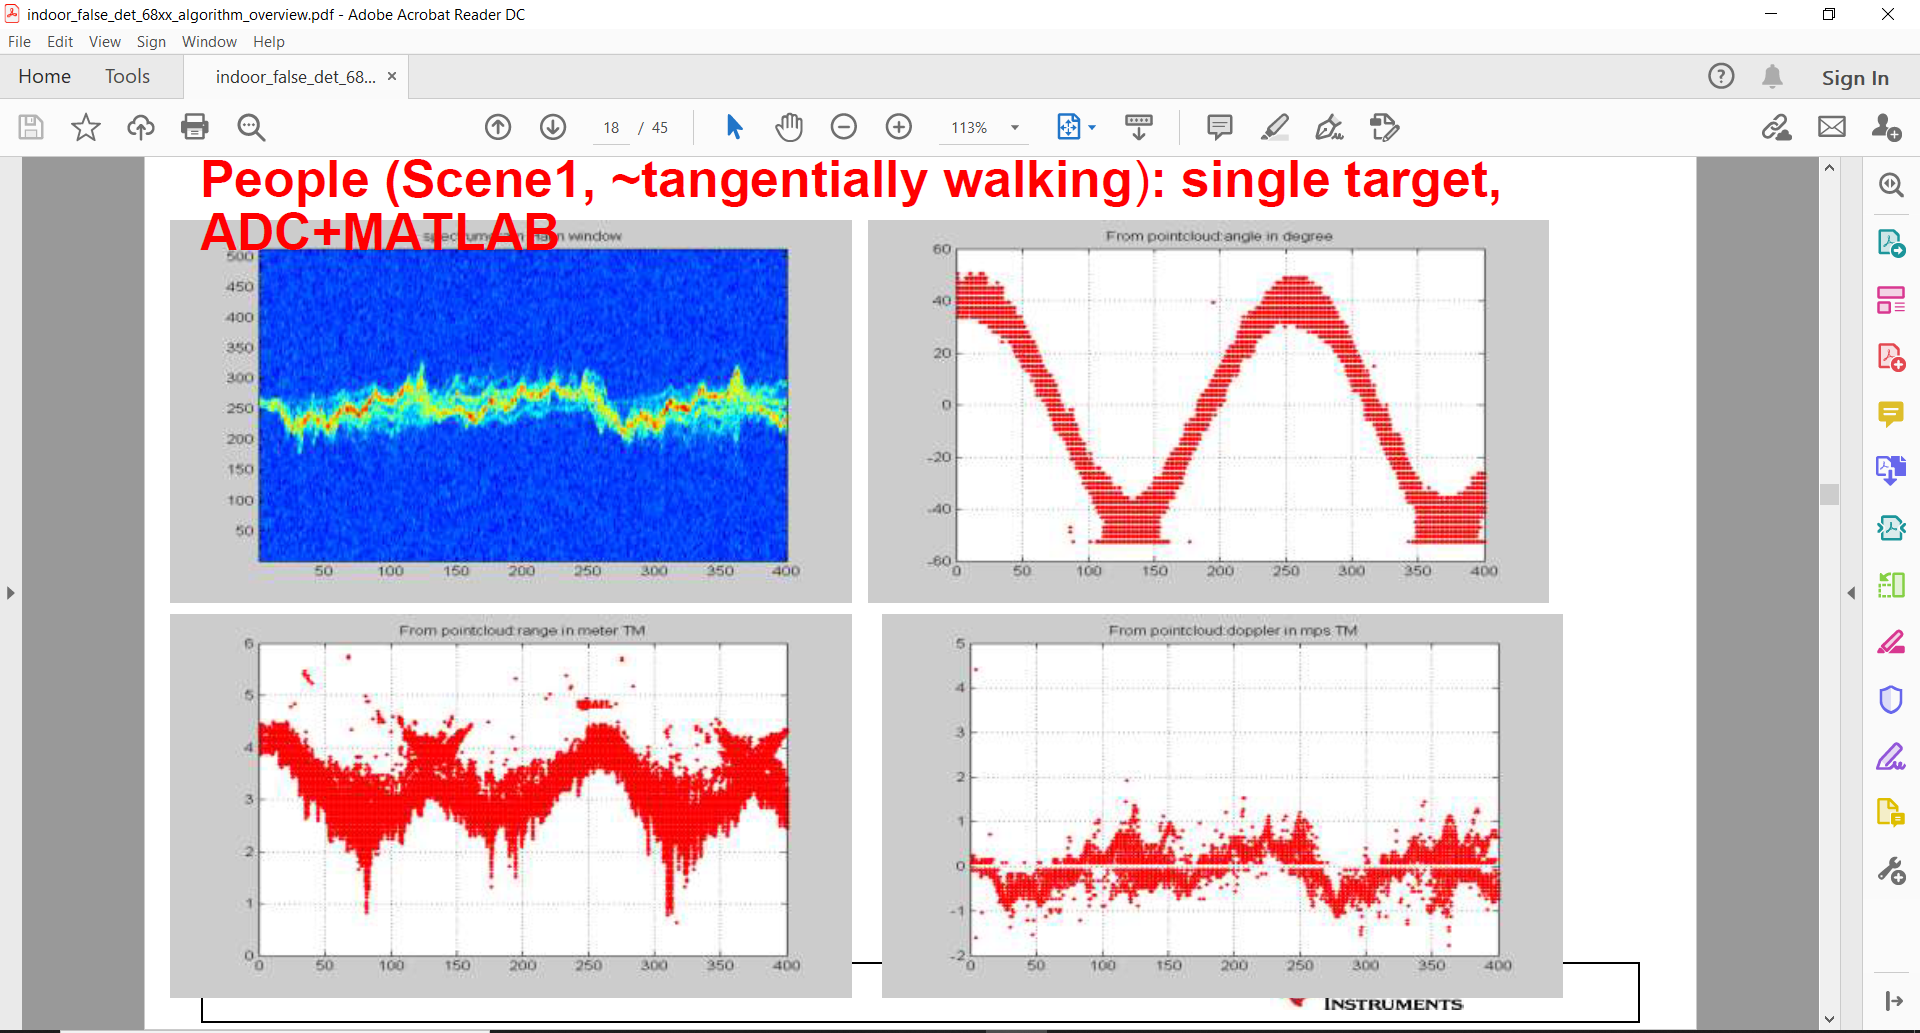
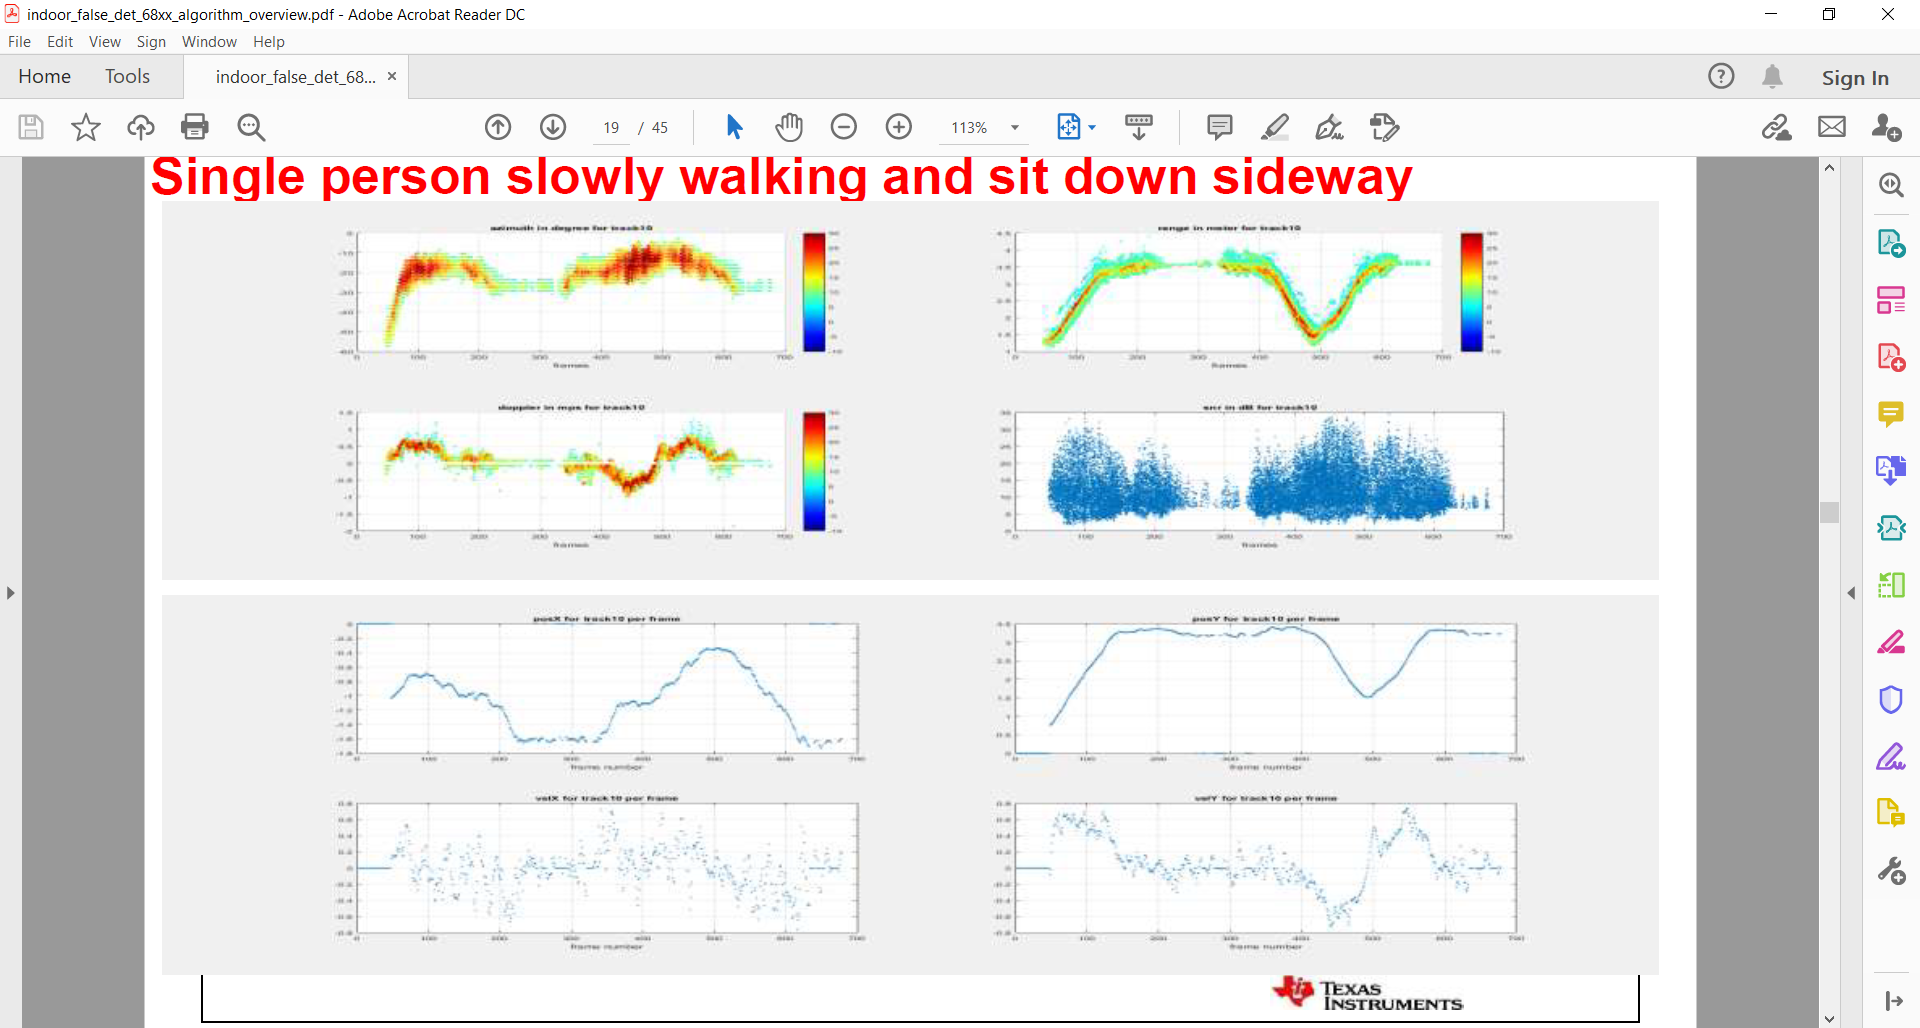
In people counting: 68xx_indoor_false_detection_mitigation lab :
How can I plot graphs of the micro doppler signature of a moving person as displayed in the "indoor_false_det_68xx_algorithm_overview.pdf" file in the docs. is there a way to plot this from the C code or the matlab gui code? and if there is no ready part for plotting this what should I use to come out with graphs like this ?