Because of the holidays, TI E2E™ design support forum responses will be delayed from Dec. 25 through Jan. 2. Thank you for your patience.

This thread has been locked.

If you have a related question, please click the "Ask a related question" button in the top right corner. The newly created question will be automatically linked to this question.

IWR6843: Matlab error while opening matlab GUI visualization

Part Number: IWR6843

Hi,

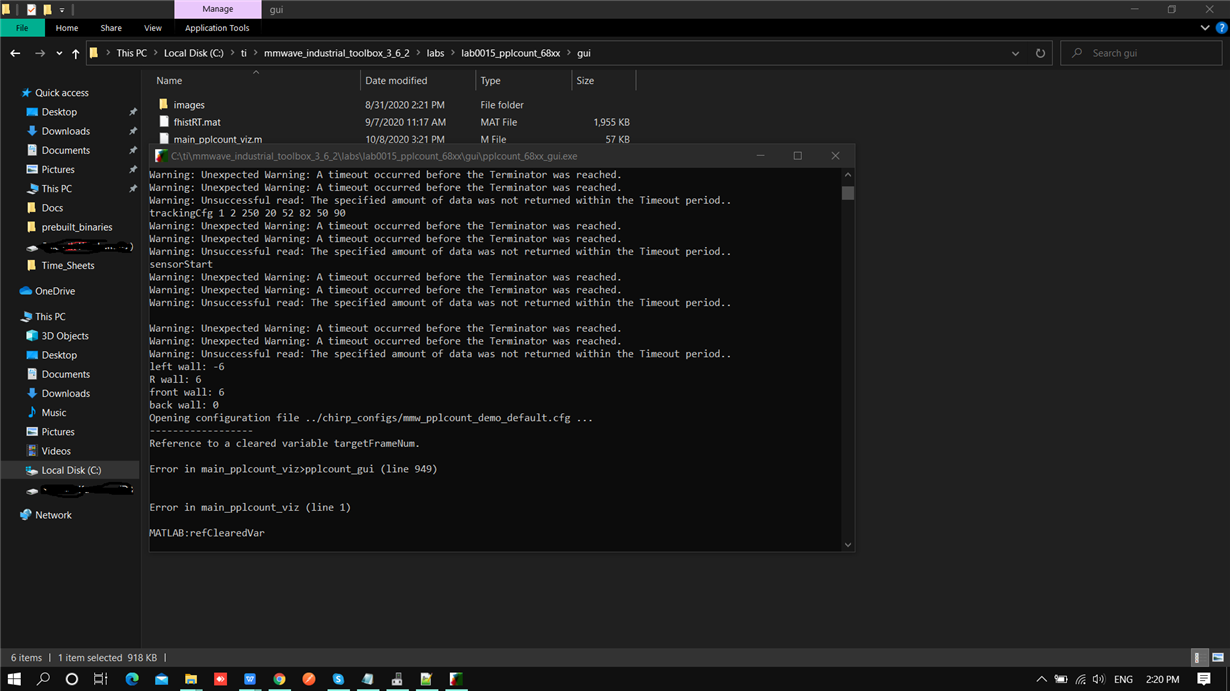
I am working on the people count project in mmwave_industrial_toolbox_3.6.2 and lab0015_pplcount_6843 file. I am trying to flash the config file and see the output through Matlab visualizer GUI, I opened GUI, selected port numbers, and connected successfully. Selected the config file as default and started visualizer. but I have seen unexpected warning while executing commands. here I am attaching an error screenshot for your reference. why I am getting these warnings and the window is closing automatically.

Regards,

Srikanth

  • Hello Srikanth,

    There are updated visualizers in the latest toolbox release, 4.5.1. Is there a specific reason you are using an older version of the toolbox? Or can you try implementing this with the latest visualizer we are supporting?

    Regards,

    Jackson

  • Thanks for letting me know about the new version. I have the following questions:-

    A) Is there any problem with an older version, can I still use the same? What problem got fixed with an older version?
    B) When I use an older version, I get the problem "MATLAB:refClearedVar". Can you provide a solution for this? (as reported in my earlier query)
    C) When I try to use a newer version, I followed the below steps

    • Selection of com ports
    • Selection of config file "ISK_6m_default.cfg"
    • Send configuration
    • No output is observed

    Regards,

    Srikanth

  • Hello Srikanth,

    The older versions should still work, but don't have the latest updates to the tracker algorithms, like 3D support. The older GUIs and demos are no longer supported.

    In general, all the demos must have matching .cfg files with the appropriate demo binary files (true for the older generation of demos also). Can you confirm that you first flashed the binary included with the demo at the below location? Also that cfg file must be used with the IWR6843ISK EVM, is this the board you are using?

    "C:\ti\mmwave_industrial_toolbox_4_5_1\labs\people_counting\68xx_3D_people_counting\prebuilt_binaries\3D_people_count_68xx_demo.bin"

    If this still isn't working with the matching board, binary, and cfg file, can you please try running the out of box demo to confirm the connection and device is working?

    Regards,

    Jackson

  • Hi Jackson,

    Thanks for the update Jackson.

    Yes, I am using an IWR6843 QG mmwave sensor with a customized board. previously I have successfully run the binary and config files with the same combination (IWR6843 QG with customized Board) and we're able to see the data in the Matlab visualizer. The below location binary file is flashed and the chirp_cfg file is used in the IWR6843 sensor.

    Binary File Path:

    "C:\ti\mmwave_industrial_toolbox_3_6_2\labs\lab0015_pplcount_68xx\prebuilt_binaries\pplcount_lab_xwr68xx.bin"

    Chrip_configs Path:

    "C:\ti\mmwave_industrial_toolbox_3_6_2\labs\lab0015_pplcount_68xx\chirp_configs\mmw_pplcount_demo_default.cfg"

    As you mentioned latest updated visualizer, I flashed the binary included with a demo at the below location.

    Binary File Path:

    "C:\ti\mmwave_industrial_toolbox_4_5_1\labs\people_counting\68xx_3D_people_counting\prebuilt_binaries\3D_people_count_68xx_demo.bin"

    In select configuration window, I have taken "ISK_6m_default.cfg" file from below path.

    Chrip_Config File Path:

    C:\ti\mmwave_industrial_toolbox_4_5_1\labs\people_counting\68xx_3D_people_counting\chirp_configs\ISK_6m_default.cfg 

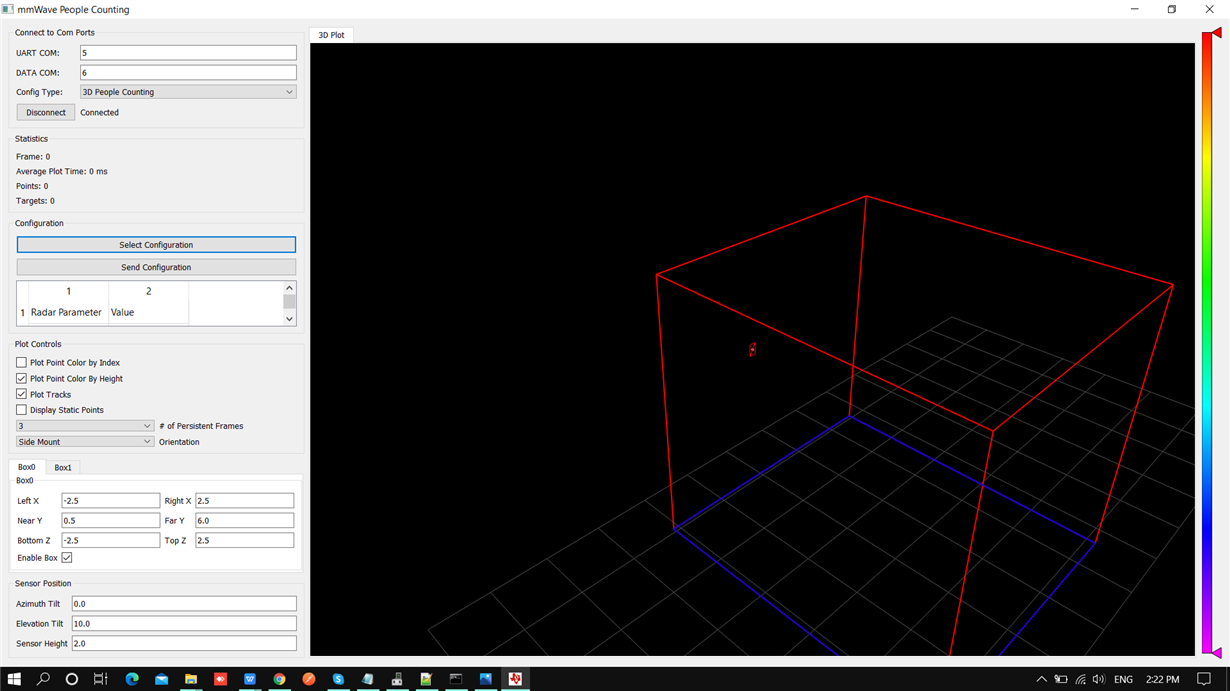
    I tried with the out of box demo as well, but I'm not able to see the data in 3D view. Here I am attaching a screenshot for your reference. 

    Regards,

    Srikanth

  • Hello Srikanth,

    Can you run the 3D gui from the python source code (there are instructions in the visualizer UG)? That way it should tell you if there are any errors occurring with your cfg file and binary setup in a terminal window. It seems that you are using compatible bin/cfg. Did you make any changes to the number of antennas brought out on your custom board?

    Were you able to run the OOB demo? This uses a different method of cfg and data transfer that is the best place to start to make sure HW/SW are working.

    Was it this particular board that was working in the past? Or a different board of the same layout?

    Regards,

    Jackson

  • Hello,

    Hopefully running from the source code you were able to figure out the issue. I am going to close this thread.

    Regards,

    Jackson

  • Thanks for the remainder Jackson,

    No, my problem is not yet resolved, while running from the command prompt using python, commands are executed but not received any data over there.

    Regards,

    Srikanth

  • Can you please post the output of the cmd window when running the python gui? 

    Also, it would be good to run the OOB demo with toolbox 4.5.1 as this should be the most simple implementation. This will make sure the connection is working properly.

    Regards,

    Jackson