


Other Parts Discussed in Thread: AWR1843
Hi,
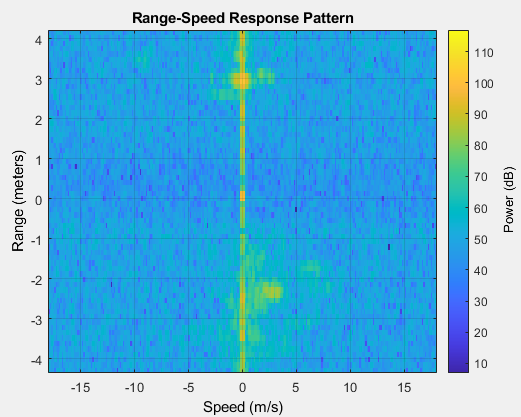
I am using AWR1843 boost along with DCA1000 for capturing ADC data.After data capturing, i am doing data parsing and plotting range Doppler plot in Matlab.My code is also attached.However, i am getting negative ranges in my plot as shown in attached figure(it should be from 0 to 8.75m according to my chirp parameters.However,targets after 4m are flipped and shown at negative ranges)?Can you kindly explain what is wrong with my data that i am getting negative ranges?Is there anything wrong with my data parsing ?The range Doppler plot which i am getting after post processing in mmWave studio is alright.
%% global variables
% change based on sensor config
clear all;close all;clc
FrameNo = 173;%frame num to calculate range doppler response
numADCSamples = 64; % number of ADC samples per chirp
numADCBits = 16; % number of ADC bits per sample
numRX = 4; % number of receivers
chirps_per_frame=255;
No_of_frames=2542;
fc = 77e9;%operating frequency
c = 3e8;
lambda = c/fc;
Nt = 2;%number of TX
fs=2e6; %ADC sampling rate
tm=54e-6; %Sweep duration+idle time
ss=35.003e12;%sweep slope
numLanes = 2; % do not change. number of lanes is always 2
isReal = 0; % set to 1 if real only data, 0 if complex data0
%% reading data file
% read .bin file
DirName = 'D:\T\dataset\Fn\70_sec\';
fileName = 'adc_data_1.bin';
fname = strcat(DirName,fileName);
fid = fopen(fname,'r');
adcData = fread(fid, 'int16');
% if 12 or 14 bits ADC per sample compensate for sign extension
if numADCBits ~= 16
l_max = 2^(numADCBits-1)-1;
adcData(adcData > l_max) = adcData(adcData > l_max) - 2^numADCBits;
end
fclose(fid);
fileSize = size(adcData, 1);
% real data reshape, filesize = numADCSamples*numChirps
if isReal
numChirps = fileSize/numADCSamples/numRX;
LVDS = zeros(1, fileSize);
%create column for each chirp
LVDS = reshape(adcData, numADCSamples*numRX, numChirps);
%each row is data from one chirp
LVDS = LVDS.';
else
% for complex data
% filesize = 2 * numADCSamples*numChirps

numChirps = fileSize/2/numADCSamples/numRX;
LVDS = zeros(1, fileSize/2);
%combine real and imaginary part into complex data
%read in file: 2I is followed by 2Q
counter = 1;
for i=1:4:fileSize-1
LVDS(1,counter) = adcData(i) + sqrt(-1)*adcData(i+2); LVDS(1,counter+1) = adcData(i+1)+sqrt(-1)*adcData(i+3); counter = counter + 2;
end
% create column for each chirp
LVDS = reshape(LVDS, numADCSamples*numRX, numChirps);
%each row is data from one chirp
LVDS = LVDS.';
end
%organize data per RX
adcData = zeros(numRX,numChirps*numADCSamples);
for row = 1:numRX
for i = 1: numChirps
adcData(row, (i-1)*numADCSamples+1:i*numADCSamples) = LVDS(i, (row-1)*numADCSamples+1:row*numADCSamples);
end
end
% return receiver data

retVal1 = adcData;

B = reshape(retVal1,[numRX,numADCSamples,chirps_per_frame,No_of_frames]);

%plotting range doppler
 rngdop = phased.RangeDopplerResponse('PropagationSpeed',c,...
    'DopplerOutput','Speed','OperatingFrequency',fc,'SampleRate',fs,...
    'RangeMethod','FFT','PRFSource','Property',...
    'RangeWindow','Hann','PRF',1/tm,...
    'SweepSlope',ss,...
    'RangeFFTLengthSource','Property','RangeFFTLength',numADCSamples,...
    'DopplerFFTLengthSource','Property','DopplerFFTLength',chirps_per_frame,...
    'DopplerWindow','Hann');
[resp1,r,sp] = rngdop(squeeze(B(2,:,:,FrameNo)));
figure(1)
plotResponse(rngdop,squeeze(B(2,:,:,FrameNo)));
Thanks

