This thread has been locked.

If you have a related question, please click the "Ask a related question" button in the top right corner. The newly created question will be automatically linked to this question.

IWR1642BOOST: IWR1642BOOST Source code

Part Number: IWR1642BOOST
Other Parts Discussed in Thread: UNIFLASH

Hi Team,

Good day 

Myself, I am Harish working as Embedded system engineer in Bengaluru.

We have borrowed IWR1642Boost mmWave (76GHz to 81GHz)Sensor Board from Ti , I am working on this Board. 

We have followed the procedure for IWR1642Boost Installation as per user guide and followed proper instructions.

SDK(3.5) Version Have compiled for IWR1642Boost Board via Uniflash Software , and We have configured the board by assigning configurations in GUI(demo visualizer/3.5) Via, Com parts(config/data) based on baudrates.(Hardware Connected)

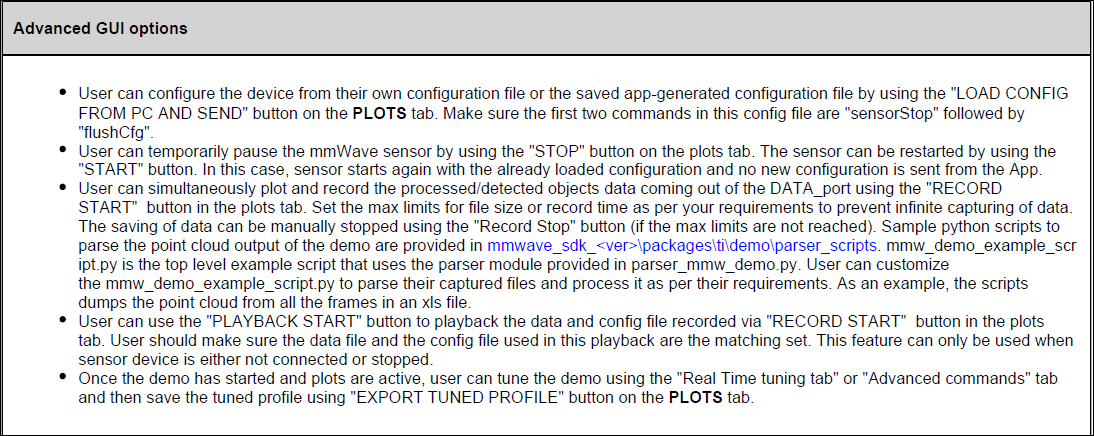
IWR1642Boost Configuration are successfully sent to mmwave sensor , We can see in plots some output data few (concentrated on) number of object detected and distance between the people (based on lateral and longitude measurements) .

We are tried to extract the data further like number of detected objects and distance between the people but we are not able to get this data externally .

We are requesting for :

We need source code of IWR1642Boost (76 to 81GHz)and Procedure to follow for compilation using code composer studio (CCS)

Thank you

Regards,

Harish Pujari

Bengaluru

  • Hello

    The source code for OOB demo is part of the mmWave SDK.

    Would you please help us understands which steps you followed for loading the image on the board but it missed out on reference to Source code so that we can include it right there.

    Thank you,

    Vaibhav

  • Hi Vaibhav,
    Good day
    Further details as below:

    “Graylinx is promoted by NR group in Mysore and is  in the business of developing and implementing IOT based building and industrial solutions.  We are developing a wireless lighting management solution that is being marketed by an OEM MNC.   We want to optimise ON/OFF control lights by sensing people present in a given area.  We also want to report no. of people present in a give area to optimise energy consumption.  Sometimes we may have to measure distance between people to ALERT in COVID SOP situation.  We need to locate and track motion ( direction also) of people to turn ON/OFF lights.


    This product will be designed and manufactured by us in India and will be sold with our wireless lighting solutions. “

    Thank You
    Regards,
    Harish Pujari
    Bengaluru
  • Hi vaibhav,

    I have followed user guide further to load image on the board, mmwave_sdk_03_05_00_04\packages\ti\demo\xwr16xx\mmw\xwr16xx_mmw_demo.bin this bin file i have loaded on the board. Because i was facing some issue on demo visualizer (target version). so , i have loaded 3.5(demo.bin) using uniflash software by mentioning com ports (because i am using windows) and via meta image 1 i have loaded this .bin file on board.

    IWR1642Boost 

    Further we used demo visualizer/3.5 version online and followed further steps

    Thank you

    Regards,

    Harish Pujari

    Bengaluru

  • Harish,

    Just to summarize, you have:

    1. Purchased an IWR1642BOOST EVM.

    2. Downloaded SDK 3.5 and flashed mmwave_sdk_03_05_00_04\packages\ti\demo\xwr16xx\mmw\xwr16xx_mmw_demo.bin on to the IWR1642BOOST EVM using uniflash. I assume this step was successful?

    3. Then you tried running the mmw demo using mmwave demo visualizer 3.5 and specified the control and data COM ports in the visualizer serial port settings.

    After this, what problem are you facing?

    What happens when you press the SEND CONFIG TO MMWAVE DEVICE button on the Configure tab in the visualizer?

    Thanks

    -Nitin 

  • Hi Nitin

    Successfully configuration are uploaded on the board when i press SEND CONFIG TO MMWAVE DEVICE , Even i can see object detected on plots based on lateral and longitudinal axis measurements.

    On Profiling section I can see "Number of Detected Objects"  6 , and when i take cursor on Plots i can see measurements based on Lateral and longitudinal axis(1.064, 6.455 Detected objects so on ) calculation.

    This two datas i need to get externally further to proceed for our application 

    How can i get this two datas externally??

    Thank you

    Regards,

    Harish Pujari

    Bengaluru

  • Hi Harish,

    Thanks for the information. So I understand that the demo is working fine for you. The demo visualizer provides a way to save the point cloud data and play it back in the visualizer. Additionally, the SDK also includes a python script to parse the data and save in into an xls file.

    Please refer to the following section in the SDK user guide:

    Thanks

    -Nitin

  • Hi Nitin,

    We have tried with the following steps which you have mentioned as per above.

    But Everytime we have to do this process Manually on Demo Visualizer/3.5, For our application process it should be automatic.

    Is thr any other ways to get "number of object detected" and "distance between the objects" via any interfaces(like SPI, I2C, UART,..... etc) with any other ???

    So, It will be helpfull for us to get this datas continuously and automatically , if necessary we will declare in between some delay.

    Thank you

    Regards,

    Harish Pujari

    Bengaluru

  • Harish,

    The demo already sends this information in the UART output continuously which is what the visualizer parses in real time and displays on the plots. If you want to read this information in your application, you can replicate the parsing function using the mmWaveDemoVisualizer source code as reference as described in the following thread. Or use the python code provided earlier and modify it to parse the output in real time.

    https://e2e.ti.com/support/sensors/f/1023/p/877608/3247117#3247117

    Thanks

    -Nitin