This thread has been locked.

If you have a related question, please click the "Ask a related question" button in the top right corner. The newly created question will be automatically linked to this question.

AWR1642BOOST: How to find the Serial port of mmWave sensor in Ubuntu 18.04LTS

Part Number: AWR1642BOOST
Other Parts Discussed in Thread: AWR1642

Hi,

I am trying to use mmWave Demo Visualizer using AWR1642BOOST.

The following steps have been done :

  1. Installed mmWave SDK
  2. Opened DemoVisualizer weblink and succesfully installed TiCloudAgent web extension
  3. While trying to install TiCloudAgent.run on PC, faced the dependency issue for 'libudev.so.0'
  4. Since 'libudev.so.1' was available, symlink from 'libudev.so.0' to 'libudev.so.1' has been done.
  5. TiCloudAgent has succesfully installed then.
  6. RADAR setup using power supply and micro USB cable has been done, but the LED was blinking (refer video)
  7. Also, I am unable to find the corresponding serial ports for the RADAR(AWR1642BOOST)


Could you please help me with finding the corresponding serial port and to resolve the blinking LED  on the RADAR board(refer video)

Hardware Configuration:

Processor: Intel Core i7-7700 CPU @ 3.60GHz × 8

RAM: 16GB

GPU: GeForce GTX 1080 Ti

Software Configuration:

OS type: Ubuntu 18.04, 64bit

Thanks

Guru

  • Hi,

    This command will list all the serial COM port available on Ubunutu/

    dmesg | grep tty

    Else please google it to find the serial COM port.

    And in the attached video I can see Red LED is blinking, that means power connection to EVM is fluctuating, so please make sure that it gets constant power connection.

    Regards,

    Jitendra

  • Hi,

    Thanks for the reply.

    Successfully resolved the power fluctuating issue with the radar.

    On using "dmesg | grep tty"  command I got the serial port numbers as "/dev/tty/ACM0 "and "/dev/tty/ACM1" but not sure of which port is related to each of config and data.
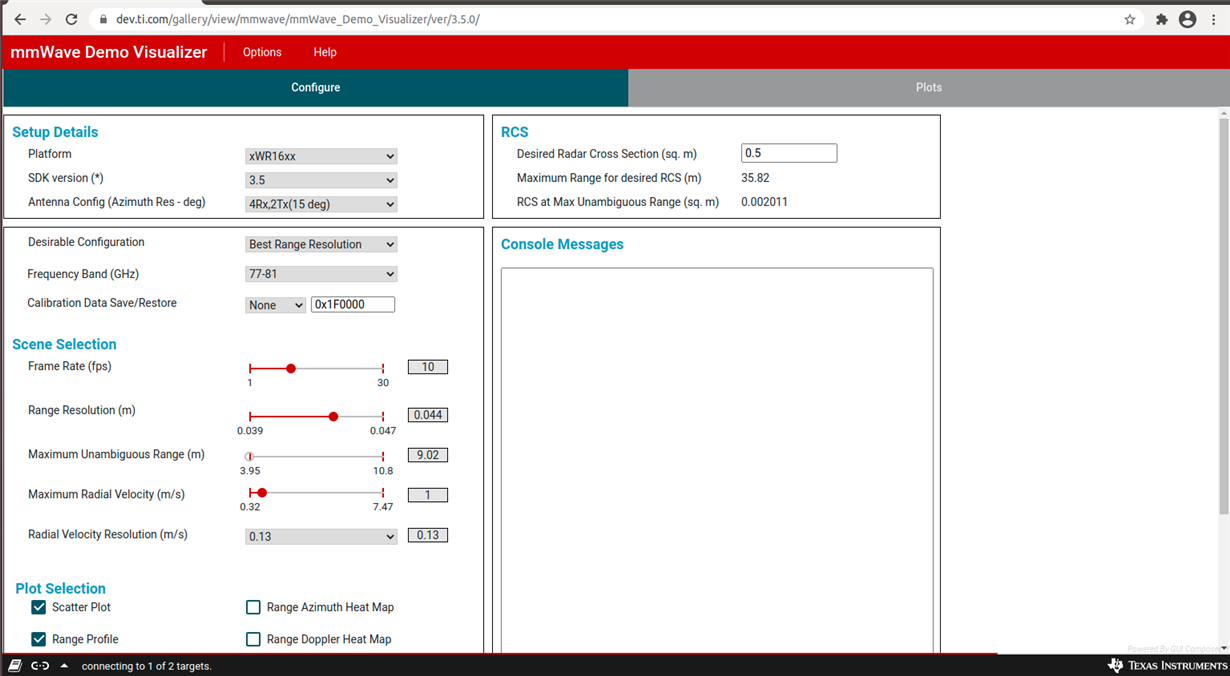
    Though I chose alternative serial ports for cfg and data port and tried to connect, I got the "Connecting to 1 of 2 targets" message at the bottom of  mmwaveDemoVisualizer(refer image) and radar is not connecting.

    mmWave_SDK v3.5 is installed.

    Also installed TiCloudAgent.run and its web extension for firefox.

    Firefox version is 86.0

    Could you please help me with these two issues.

    1. Finding the correct serial port number for CFG and DATA
    2.Resolving the "Connecting to 1 of 2 targets" issue.

    Thanks
    Guru

  • Hi,

    In Linux I'm not in which order COM ports are enumerated but you need to try both combination.

    Make sure that device is flashed with the mmw demo and set into functional mode. You can confirm the device functionality by connecting to COM port at 115200 baud rate using some serial terminal tool and press ENTER after connection, it should show 'mmwDemo:>' prompt on the screen. It will confirm that device is up with the application and that is right COM port for CLI-CFG COM port used in the visualizer.

    If above steps are done and got the right COM ports, then try to send configuration to the device (click button 'send config to mmwave device' in visualizer) even after it says 'connecting to 1 of 2 targets'. It should send config command and visible on console messages of this webpage.

    Regards,

    Jitendra

  • Hi,

    Thanks for the reply.

    Found the COM ports and ran mmwave Demo Visualizer successfully.

    Demo visualizer shows the scatter plot of objects detected for about 10 meters and in configuration tab, Maximum Unambiguous Range (meters) also has max value of 10.8 only.

    Q1. Can I extend the range to 40m in the DemoVisualizer, if not how can I do the same?

    In this Video ( Link ) I can see the scatter plot range upto 80m, it tracks the objects and shows a free space grid too.

    Q2. Can I get the free space grid and object clustering in mmwave DemoVisualizer ? If not, guide me to find the same.

    The AWR1642 BOOST board is heating if used over a time period of 30 minutes.

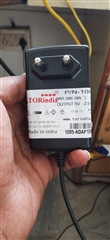
    Q3. How to handle this issue? Please refer image for the adapter I use. I am expecting it to work for an entire day.

    Thanks

    Guru

  • Hello Guru,

    1) mmw demo is meant for demo purpose only so it has range limitation. However you can change the max range, refer setting from below snapshot- 

    2) That video is based on SRR application, you can find that from below link

    https://dev.ti.com/tirex/explore/node?node=AE.lBfxUS339OGZzEWf4fg__AocYeEd__LATEST

    3) In Visualizer you can see all the possible plots under the PLOT TAB, those are the only supported feature by Visualizer.

    If you are referring SRR demo from above link, it shows different plot as shown in the video, hope that may help you.

    4) Power spec looks fine of your power adaptor. However device may get heated a bit over use. You need to make sure that you should not use frame duty cycle more than 50%, i.e. 50% active and 50% idle time in frame duration. This way you can run this device for longer time without any issue.

    Regards,

    Jitendra

  • Hi,

    Thanks for the reply.

    Stated solution was really helpful.

    2) That video is based on SRR application, you can find that from below link

    https://dev.ti.com/tirex/explore/node?node=AE.lBfxUS339OGZzEWf4fg__AocYeEd__LATEST

    On proceeding with user guide I was unable to run srr_visualization.exe as I was using Ubuntu OS(attached System Config below). I tried to execute the file using ./ commandgot the following error

    run-detectors: unable to find an interpreter for ./srr_visualization.exe

    and also I tried using wine srr_visualization.exe but got the MATLAB runtime error. I have installed MATLAB 9.2 runtime, this does not fix the problem.

    Do we can run this SRR application in Ubuntu based systems too?

    System Configuration:

    OS type: Ubuntu 18.04.5 LTS, 64 bit
    Processor: AMD Ryzen 7 3800x 8 Core Processor x 16
    GNOME : 3.28.2
    GPU: GeForce GTX 1080 Ti

    Thanks

    Guru

  • Hello Guru,

    This visualizer exe is built for Windows OS, and not being tested under Ubuntu.

    I would request you try with Windows OS and matlab runtime version R2017a (9.2) as per release note of SRR lab.

    Regards,

    Jitendra