This thread has been locked.

If you have a related question, please click the "Ask a related question" button in the top right corner. The newly created question will be automatically linked to this question.

IWR6843ISK: questions related to Demo visualizer

Part Number: IWR6843ISK

Hello support team,

I have three questions related to your Demo visualizer.

1. As advised in MMWAVE SDK user guide (v3.4), I have installed xwr68xx_mmw_demo.bin to IWR6843ISK board and powered it up with visualizer. But Auxillary Data port connection is always failed. If I install custom firmwave created by us, it is connected well without any change on hardware setup. I am fine if you could advise to fix this issue with your firmware.

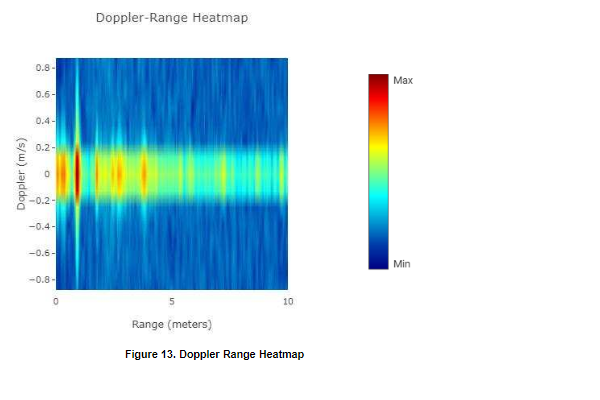
2. I would like to select below format of range-doppler heat map rather than default dot format. According to demo visualizer user guide 3.5 Range-Doppler Heatmap, it may be configured somehow but I am not sure how to set up. I am fine if you could advise to select preferred format.


3. I would like to analyse recorded stream as mentioned in demo visualizer user guide 4.4 Concurrent Recording of Processed Stream From mmWave Device, but I can't find propoer document in SDK to understand the data format. Please kindly let me know where to read.

Best regards,

Taka

  •  Hello

    Regarding 2nd question, let me attach a picture.

    Best regards,

  • Taka:

    1. Make that you follow the instructions on the OOB User's Guide carefully. A common cause that may be causing the issue is that you have to cycle power on the EVM before flashing and after flashing. Additionally make sure that you are using the correct COM port + baud rate in the visualizer. Also if you are using and ICBOOST make sure that you have followed the HW setup correctly.

    2. If you want to select the Doppler-Range Heatmap then you will need to go the following file and look for the guiMonitor CLI command and modify your .cfg file accordingly.

    <MMWAVE SDK INSTALL PATH>\docs\mmwave_sdk_user_guide.pdf

    3. Go the following HTML file and look for the section denoted as: "Output information sent to host" this will describe the output data format.

    <MMWAVE SDK INSTALL PATH>\packages\ti\demo\xwr68xx\mmw\docs\doxygen\html\index.html

        Additionally you can go to the following path to find a parser coded in python which utilizes the information described above.

    <MMWAVE SDK INSTALL PATH>\packages\ti\demo\parser_scripts

    Let me know what happens with regards to getting the visualizer to work.

    Best regards,

    Connor Desmond

  • Hello Connor,

    Thank you for your reply.

    1. It works fine with "Best Range Resolution". But I notice it don't work with "Best Velocity Resolution.". 

    1) Port configuration is successfully done.

    2) Platfom = xWR64xx, Desirable Configuration=Best Velocity Resolution, Frame Rate = 4

    3) Check "Range Doppler Heat Map"

    4) Press "SEND CONFIG TO MMWAVE DEVICE"  --> CLI command is installed according to log but nothing appears in Plot tab. 

    If 3) is skipped, output appears in Plot tab. Also, If Desirable Configuration=Best Range Resolution, output appears om Plot tab.

    2. It seems preferred format appears with default setting. Thanks.

    3. According to index.html which you inform me about, I understand point cloud is included in captured data but I can't find what type of information are delivered for each point clouds.

        I hope x, y, z, SN and doppler would be delivered. Anyway, I am fine if you can advise where I should check. 

    Best regards,

    Taka

  • Taka:

    1. I ran the GUI visualizer with your settings and was able to make the visualizer functional. Note the platform should be xWR68xx, not xWR64xx, but I don't think this is the problem because if you send the config using the GUI it will tell you that you are not using the correct platform. I would make sure that you are using the correct binary, power cycling after and before flashing, and making sure that you are using the correct COM ports. Also make sure you are using the GUI Visualizer version 3.5.0.

    2. If you manually load a .cfg file you would modify the command I referenced previously. If you want Doppler Heat Map then you check the box and that does the same modification to the .cfg that the visualizer sends just so you know.

    3. The detected objects TLV described in index.html that I referenced above gives x,y,z, and radial velocity for each detected object. In addition to that TLV you can have the device send out additional information e.g. range profile, doppler heat map, etc. The basic descriptions of these output TLVs are described in index.html

    Best regards,

    Connor Desmond