This thread has been locked.

If you have a related question, please click the "Ask a related question" button in the top right corner. The newly created question will be automatically linked to this question.

DCA1000EVM: Strange output when processing raw data from AWR1642

Part Number: DCA1000EVM
Other Parts Discussed in Thread: AWR1642BOOST

Hi,

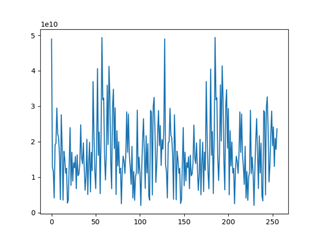
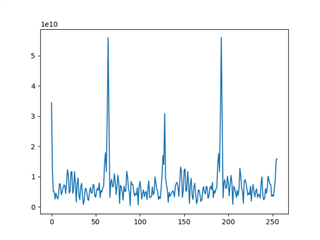
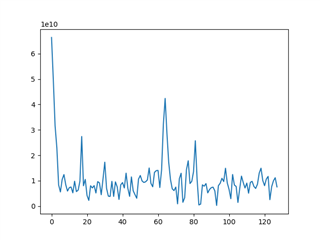
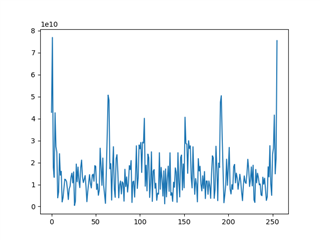
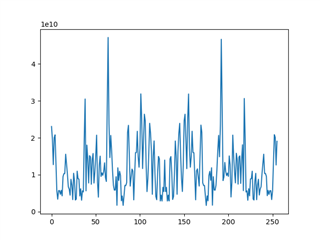
I have been extracting raw data from the AWR1642BOOST using the DCA1000EVM and have been trying to process it. I have performed fft across the samples within the chirp to get the range information, but the output seems to have periodic peaks, even when there is nothing in front of the radar ( looking out of my window). They seem to be around 64, 128 and 192 - out of 256 bins. I have also done the doppler and azimuth calculations, but both also have the same periodic peaks. Has anyone come across this before or have any idea why it might be happening?

Thank you,

Charlie

  • HI, Charlie:  

    Are you using radar studio GUI for data capture?  If possible, please send me the range-Doppler heatmap plot in the radar studio postProc display.   

    Best,

    Zigang

  • Hi Zigang ,

    Thanks for your response. No I am not using the radar studio or mmwave studio I am using the CLI software in Linux and then collecting the frames from the ethernet port.

    Charlie

  • 1) are you using OOB demo binary for LVDS raw data capture?

    2) Is this a new problem?  or it is your first time to check the data?

    3) Can you check the ADC samples cross different chirps for a particular antenna are on top of each other.  To prove you have stable connection and also you have catch the frame start. 

    4) Can you send me a plot of you range FFT output or range-doppler output (amplitude in dB) for a particular antenna?  It is very possible that your data parsing has some problem

    Best,

    Zigang   

  • Hi Zigang,

    No I am not using the OOB demo- where would I find it?
    I will put those graphs together for you in a sec.

    Thanks,

    Charlie

  • Here is the plot of the absolute value of the Range after a single 1D fft across the samples within the chirp.

    Charlie

  • This is the same process, but with a hamming window applied

    there shouldn't be targets at these positions

  • HI, 

    It seems that your data parsing script has some problem.  Can you let me know what binary you are loading/flashing to the EVM and what data format you are assuming for your post processing?

    Best,

    Zigang

  • I have not chnaged the binary- I assume I am using a standard one from the demo visualiser/mmwave studio. The contents of the CFG file that is sent to the sensor is  below. I assume that it is in two stream LVDS format with complex numbers, 4 rx 256 samples per chirp 16 chirps per frame. I also assume that the chirps alternate between the two tx antennas. I have also inserted my python script to receive the output data below. I also read that you receive two real numbers and then the corresponding two imaginary numbers.

    Thank you again for your help,

    Charlie

    CFG

    sensorStop
    flushCfg
    dfeDataOutputMode 1
    channelCfg 15 3 0
    adcCfg 2 1
    adcbufCfg -1 0 1 1 1
    profileCfg 0 77 385 7 49.03 0 0 18.75 1 256 6250 0 0 30
    chirpCfg 0 0 0 0 0 0 0 1
    chirpCfg 1 1 0 0 0 0 0 2
    frameCfg 0 1 16 0 1000 1 0
    lowPower 0 1
    guiMonitor -1 1 1 0 0 0 1
    cfarCfg -1 0 2 8 4 3 0 15 1
    cfarCfg -1 1 0 4 2 3 1 15 1
    multiObjBeamForming -1 1 0.5
    clutterRemoval -1 0
    calibDcRangeSig -1 0 -5 8 256
    extendedMaxVelocity -1 0
    bpmCfg -1 0 0 1
    lvdsStreamCfg -1 1 1 1
    compRangeBiasAndRxChanPhase 0.0 1 0 1 0 1 0 1 0 1 0 1 0 1 0 1 0
    measureRangeBiasAndRxChanPhase 0 1.5 0.2
    CQRxSatMonitor 0 3 14 123 0
    CQSigImgMonitor 0 123 14
    analogMonitor 0 0
    aoaFovCfg -1 -90 90 -90 90
    cfarFovCfg -1 0 0 34.99
    cfarFovCfg -1 1 -1 1.00
    calibData 0 0 0
    sensorStart

    Python script

    import os,sys,socket,time,numpy as np,struct, matplotlib.pyplot as plt,math


    def prep():
        os.system('sudo ifconfig eth0 192.168.33.30 netmask 255.255.255.0')
        s=socket.socket(socket.AF_INET, socket.SOCK_DGRAM, socket.IPPROTO_UDP)
        s.bind(('192.168.33.30',4098))
        return(s)

    def readpacket(s):
        
        r=s.recv(1466)

        len_data=(1456//2)
        
        data=[0]*(len_data)
        
        packet_number=struct.unpack('<1l',r[:4])[0]#[42:46])
        byte_count=struct.unpack('>Q',b'\x00\x00' + r[4:10])[0]#[46:52])
        for k in range(len_data):
            data[k]=struct.unpack('<i',r[10+k:14+k])[0]
        print(packet_number)
        return(data,packet_number,byte_count)
        
        
        #plt.plot(q,bc[0:100],'.')
        #plt.show()
    def readframe(s):
        packets=[]
        packets_read=0


        ChirpsPerFrame=16
        SamplesPerChirp=256
        RealImag=2
        rxChannels=4
        txChannels=2
        VirtualA=rxChannels*txChannels
        Bytes=2
        FrameLen=(ChirpsPerFrame*SamplesPerChirp*RealImag*rxChannels*Bytes*txChannels)
        BytesInPack=1456
        BytesInFrame=(FrameLen//BytesInPack)*BytesInPack
        PackInFrame=BytesInFrame//BytesInPack
        print(PackInFrame)


        #Find start of frame
        while True:
            
            data,packNum,ByteCount=readpacket(s)
            
            
            if ByteCount%(32768*2)==0:
                print('Start of frame')
                
                packets=packets+data
                
                startPack=packNum
                break
            else:
                print('Waiting for start of frame')
        while packNum-startPack<=91:
            #while data==None or packNum==None or ByteCount==None:
            data,packNum,BytesCount=readpacket(s)
            print(packNum-startPack)
            packets=packets+data
            #print(len(packets))
                
        Frame=np.empty((ChirpsPerFrame,8,SamplesPerChirp),dtype=complex)        
        ComplexPack=np.empty(len(packets)//2,dtype=complex)
        i=0
        j=0
        x=0
        TotChirp=1024
        for x in range(len(packets)):
            if x%4==0 or x%4 == 1:
                
                ComplexPack.real[i]=packets[x]
                i=i+1
            elif x%4==2 or x%4==3:
                ComplexPack.imag[j]=packets[x]
                j=j+1
            else:print('error')
        #print(ComplexPack)
            #print(len(packets), FrameLen//4)
        #Makes an array where each row corresponds to a virtual rx channel     
        for x in range(16):
      
            Frame[x,0,np.arange(SamplesPerChirp)]=ComplexPack[x*TotChirp:(SamplesPerChirp+x*TotChirp)]
            Frame[x,1,np.arange(SamplesPerChirp)]=ComplexPack[(SamplesPerChirp+x*TotChirp):(2*SamplesPerChirp+x*TotChirp)]
            Frame[x,2,np.arange(SamplesPerChirp)]=ComplexPack[(2*SamplesPerChirp+x*TotChirp):(3*SamplesPerChirp+x*TotChirp)]
            Frame[x,3,np.arange(SamplesPerChirp)]=ComplexPack[(3*SamplesPerChirp+x*TotChirp):(4*SamplesPerChirp+x*TotChirp)]
            Frame[x,4,np.arange(SamplesPerChirp)]=ComplexPack[(4*SamplesPerChirp+x*TotChirp):(5*SamplesPerChirp+x*TotChirp)]
            Frame[x,5,np.arange(SamplesPerChirp)]=ComplexPack[(5*SamplesPerChirp+x*TotChirp):(6*SamplesPerChirp+x*TotChirp)]
            Frame[x,6,np.arange(SamplesPerChirp)]=ComplexPack[(6*SamplesPerChirp+x*TotChirp):(7*SamplesPerChirp+x*TotChirp)]
            Frame[x,7,np.arange(SamplesPerChirp)]=ComplexPack[(7*SamplesPerChirp+x*TotChirp):(8*SamplesPerChirp+x*TotChirp)]

        return(Frame)#This returns the datacube

  • You need to check your data card config json file, and see whether you reorderEnable is set to 1.   You also need to check adcBufCfg (available in the SDK users guide), see whether it is Q sample first or I sample first.  Then you can modify your parsing script accordingly.   Below are some notes that may apply to you depend on reorderEnable and adcBufCfg settings.

    % data parsing
    % with reorderEnable set to 1 in datacard config json file
    % the data is already in the order of complex pairs
    % the out of box demo support the adcbufCfg with Q first
    % The original data format is listed in figure 11 before reorderEnable at:
    % www.ti.com/.../swra581b.pdf
    adcOut = dataChunk(2:2:end) + 1j*dataChunk(1:2:end);

    Best,

    Zigang

  • Hi Zigang,

    I think you might be right that that is where the problem is. I have posted my json file below. i am confused what the bit at the end means after "dataportConfig"- could this have an effect?

    Thank you,

    Charlie

    {"DCA1000Config":
    {"dataLoggingMode": "raw",
    "dataTransferMode": "LVDSCapture",
    "dataCaptureMode": "ethernetStream",
    "lvdsMode": 2,
    "dataFormatMode": 3,
    "packetDelay_us": 25,
    "ethernetConfig": {
        "DCA1000IPAddress": "192.168.33.180",
        "DCA1000ConfigPort": 4096,
        "DCA1000DataPort": 4098},
    "ethernetConfigUpdate": {
        "systemIPAddress": "192.168.33.30",
        "DCA1000IPAddress": "192.168.33.180",
        "DCA1000MACAddress": "12.34.56.78.90.12",
        "DCA1000ConfigPort": 4096,
        "DCA1000DataPort": 4098},
    "captureConfig": {
        "fileBasePath": "/home/charlie/SourceCode/Release/data",
        "filePrefix": "Capture",
        "maxRecFileSize_MB": 1024,
        "sequenceNumberEnable": 1,
        "captureStopMode": "infinite",
        "bytesToCapture": 5000,
        "durationToCapture_ms": 5000,
        "framesToCapture":1},
    "dataFormatConfig": {
        "MSBToggle": 0,
        "reorderEnable": 1,
        "laneFmtMap": 0,
        "dataPortConfig": [{
            "portIdx": 0,
            "dataType": "real"  },
            {"portIdx": 1,
            "dataType": "complex"  },
            {"portIdx": 2,
            "dataType": "real"  },
            {"portIdx": 3,
            "dataType": "real"  },
            {"portIdx": 4,
            "dataType": "complex"  }]
        }
        }
    }

  • Hi Zigang,

    Thank you so much for the help. That seems to have made it work.

    this graph is more what I expected.

    Charlie

  • You are right.  The dataType on my json file are all set to complex.  But I did not find any information on the DCA1000 CLI user guide 

    C:\ti\mmwave_studio_02_01_01_00\mmWaveStudio\ReferenceCode\DCA1000\Docs\TI_DCA1000EVM_CLI_Software_UserGuide.pdf

    "dataPortConfig": [
    {
    "portIdx": 0,
    "dataType": "complex"
    },
    {
    "portIdx": 1,
    "dataType": "complex"
    },
    {
    "portIdx": 2,
    "dataType": "complex"
    },
    {
    "portIdx": 3,
    "dataType": "complex"
    },
    {
    "portIdx": 4,
    "dataType": "complex"
    }
    ]

    Best,

    Zigang

  • Great, I am glad to hear that.  Do you have to change the dataType to "complex"?

    Best,

    Zigang

  • I have changed them all to complex and it doesnt seem to make much difference. I'm slightly confused by the output I've got still though. The plot I sent before was only half of the fft response, if I plot the full response I get a reflection across the middle of the graph like the plots below. Is this expected? Does it show that I have something specific wrong?

    Charlie

  • It looks like the input is a real signal, not a complex signal.   Do you use the complex signal as FFT input?

    Best,

    Zigang

  • I used the absolute value of the complex output from the radar

  • Sorry thats wrong i used the complex data and then plotted the absolute value.

  • Do you know what "dataFormatMode": 3, in the json file means?

  • Please can find this information in the users guide located at: C:\ti\mmwave_studio_02_01_01_00\mmWaveStudio\ReferenceCode\DCA1000\Docs

    Best,

    Zigang

  • Sorry for the slow response, I have been busy doing something else. That info is very helpful, thank you. I was wondering if you know of a reference code for this application of processing the raw data to get the range, Doppler and azimuth information.

    Thanks,

    Charlie 

  • There is some python script located at: 

    C:\ti\mmwave_sdk_03_05_00_04\packages\ti\demo\parser_scripts

    And for all demo code, the source target code is available. 

    Best,

    Zigang

  • Thanks for that. What would you suggest the best method of calculating the range-azimuth information is?

    Charlie

  • HI, Charlie:

    Please submit a different e2e thread regarding your new questions. 

    Best,

    Zigang