Hi,
I would like to confirm my interpretation of the range FFT that uses complex ADC samples at its input is correct.
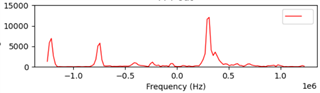
Below I am sharing the range FFT output I obtained for one chirp. As you can see there are negative and positive frequencies. I understand the entire frequency range displayed in this plot carries useful information where each frequency bin (be it positive or negative) corresponds to a valid range bin. Therefore, the minimum frequency (which is about -1.22 MHz) in the below plot will correspond to range bin zero, and the highest frequency (i.e. +1.22 MHz in the same plot) will correspond to the maximum range bin. In order to make the frequency - range bin translation, first I will add 1.22 MHz to all of the frequencies displayed below so that the -1.22 MHz is offset to 0 MHz (i.e. the smallest range bin at 0 meters to the radar). After this step, the maximum frequency will be 2.44 MHz. I will then convert each frequency (f) to its corresponding range in meters (d) as follows:
d = (fc/2S)
where,
c : speed of light in m/sec
S : frequency slope in MHz/sec
(I performed a quick sanity check by converting 2.44 MHz to its range bin, which works out to be 6.79 meters and is inline with my expected maximum range)
Can you please confirm whether my approach above is correct?
Thank you for your help and support.
Regards,
Cagri