This thread has been locked.

If you have a related question, please click the "Ask a related question" button in the top right corner. The newly created question will be automatically linked to this question.

IWR1843: How to get the SNR in System Test With Static Object of SWRA577

Part Number: IWR1843
Other Parts Discussed in Thread: DCA1000EVM

Hi,

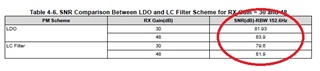
In table 10 of SWRA577 (XWR1xxx Power Management Optimizations – Low Cost LC Filter Solution), it shows the SNR Comparison Between LDO and LC Filter solution.

How to get the value of SNR in the table 10? Are they from the ADC raw data captured by DCA1000EVM or from test tool, such as spectrum analyzer?

My customer would like to know the detail. Would you pls kindly help?

  • Hi,

    1. The ADC raw data capture snippets shown are screenshots of the MMWAVESTUDIO using DCA1000EVM.
    2. If you are referring to table 4-6 then its explained in the preceding section 4.2.3.

    Please let me know if I am not understanding the question.

    Regards,

    Charles O

  • Charles,

    Sorry. I was using older version of this app note. Yes. For swra577a, customer wants to know how to get the SNR value in table 4-6 as showed in below red circle.

    Section 4.2.3 is talking about Spur level measurements. Below is copied from app note. Do you mean we use continuous tone at 77Ghz to get the SNR? Which measurement tool was used? Would you pls kindly share the detail steps to get the SNR?

    For Spur level measurements, a continuous tone at 77 GHz is transmitted and the received signal is analyzed
    with 524288 samples for the presence of the PMIC switching frequency spur at ~4 MHz.

  • Hi,

    Please allow some more time to look into this and get back to you.

    Regards,

    Charles O

  • Chris,

         These measurements are done with the help of mmWave studio, SNR could be computed in the chirping mode with the configuration specified in the app-note. mmWave studio provides plots signal and Noise spectrum options in the post processing options from this one could compute the SNR values. 

       For spurious spurs measurements setup, in this case, it's PMIC spur, This is using mmWave studio in CW mode at 77GHz band and in the Rx Mode. These measurement are conducted in controlled environment with Waveguide setup by feeding the CW RF tone at the receiver inputs and setting the LO frequency (within our device in CW mode) such that within 15MHz IF bandwidth. This will results in beat frequency within bandwidth of ADC spectrum and spurious tone could be seen. 

    Similar measurement could be conducted in Chirping mode as well, by setting the slope to zero, With this all the objects would fall into DC bin and only spurious spectrum would be visible at the ADC spectrum output. 

    Thanks and regards,

    CHETHAN KUMAR Y.B.