


Other Parts Discussed in Thread: IWR1443, IWR1642, , IWR1443BOOST
Hello!
I am experimenting with IWR1642, IWR1443
The figure below is a screenshot of the screen displayed in High_Accuracy_Visualizer 1.2.0.
- IWR1642BOOST
- IWR1443BOOST
I am testing the level_sensing of mmwave_industrial_toolbox_4_6_0.
--------------------------------------------------------------------------------------------------------------------------------
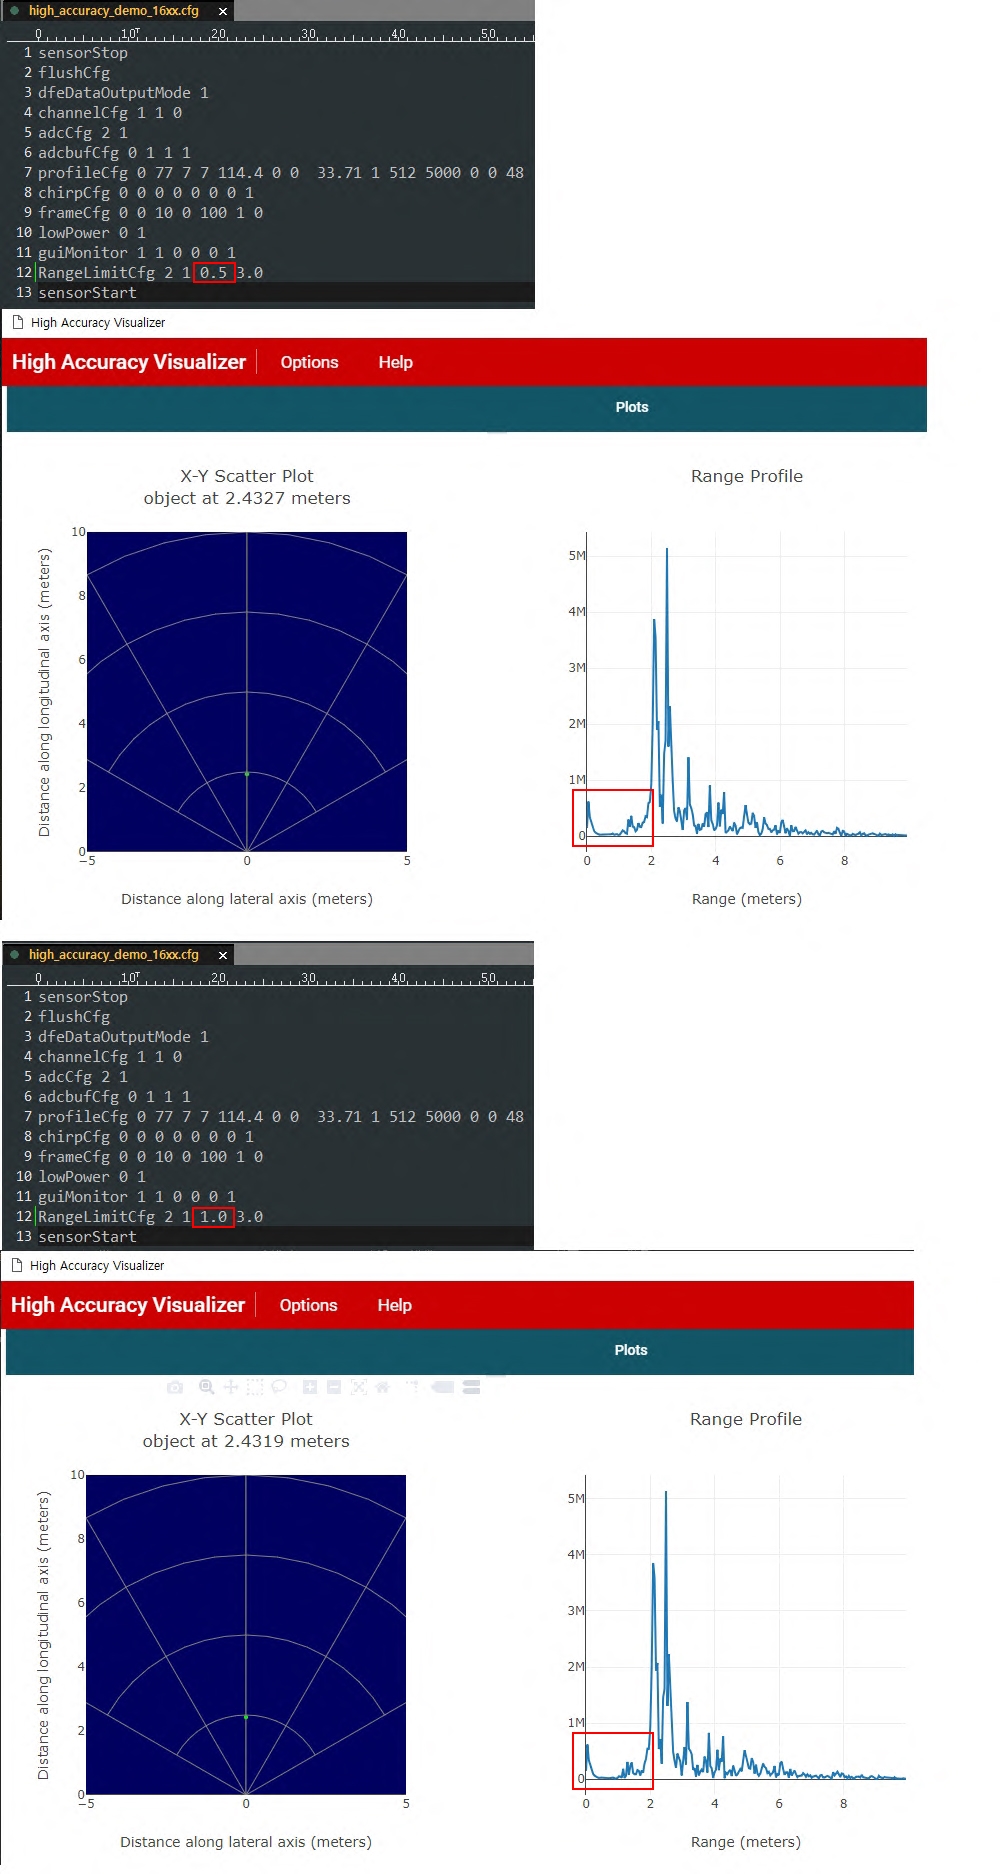
IWR1642BOOST's RangeLimitCfg was changed.
However, there is no change in the FFT graph displayed in the Range Profile.
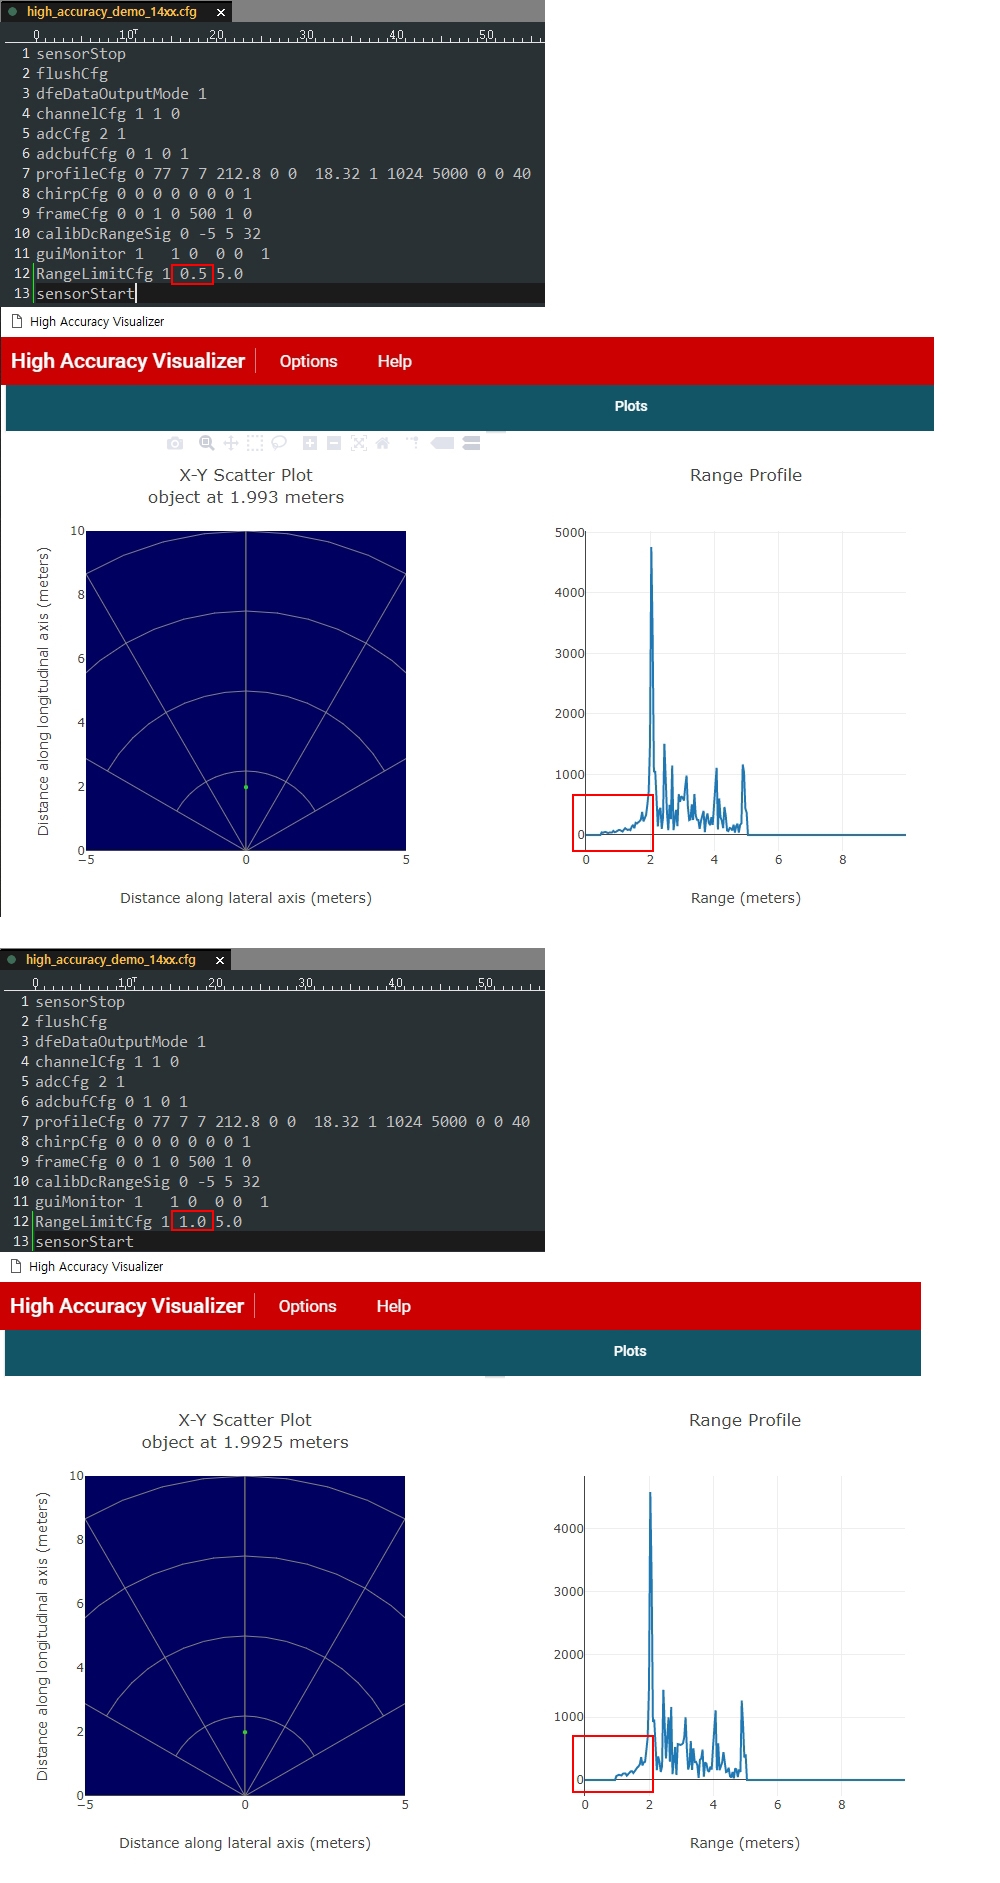
IWR1443BOOST's RangeLimitCfg was changed.
The FFT graph displayed in the Range Profile changes the min range according to the value defined in high_accuracy_demo_14xx.cfg.
High_Accuracy_Visualizer 1.2.0. Please let me know if it displays differently.
--------------------------------------------------------------------------------------------------------------------------------
--------------------------------------------------------------------------------------------------------------------------------
What is the meaning of RangeLimitCfg 2 1 1.0 3.0 in the contents of high_accuracy_demo_16xx.cfg?
RangeLimitCfg
2 : ???
1 : ???
1.0 : min range
3.0 : max range
--------------------------------------------------------------------------------------------------------------------------------
thanks

