Tool/software: TI-RTOS
Reposting for clarity. Still confused on this issue.
Jitendra,
I apologize for the continued problem, but I am still not getting results that I would expect for the HW trigger on the AWR1642BOOST ES2.0. I resorted to the demo visualizer for the ease of viewing changes. Here is the configuration script I would load each time:
sensorStop
flushCfg
dfeDataOutputMode 1
channelCfg 15 3 0
adcCfg 2 1
adcbufCfg -1 0 0 1 0
profileCfg 0 77 429 7 57.14 0 0 70 1 256 5209 0 0 30
chirpCfg 0 0 0 0 0 0 0 1
chirpCfg 1 1 0 0 0 0 0 2
frameCfg 0 1 16 0 100 2 0
lowPower 0 1
guiMonitor -1 1 1 0 0 0 1
cfarCfg -1 0 0 8 4 4 0 5120
cfarCfg -1 1 0 4 2 3 0 5120
peakGrouping -1 1 1 1 1 255
multiObjBeamForming -1 1 0.5
clutterRemoval -1 0
calibDcRangeSig -1 0 -5 8 256
extendedMaxVelocity -1 0
bpmCfg -1 0 0 1
lvdsStreamCfg -1 0 0 0
nearFieldCfg -1 0 0 0
compRangeBiasAndRxChanPhase 0.0 1 0 1 0 1 0 1 0 1 0 1 0 1 0 1 0
measureRangeBiasAndRxChanPhase 0 1.5 0.2
CQRxSatMonitor 0 3 5 123 0
CQSigImgMonitor 0 127 4
analogMonitor 1 1
sensorStart
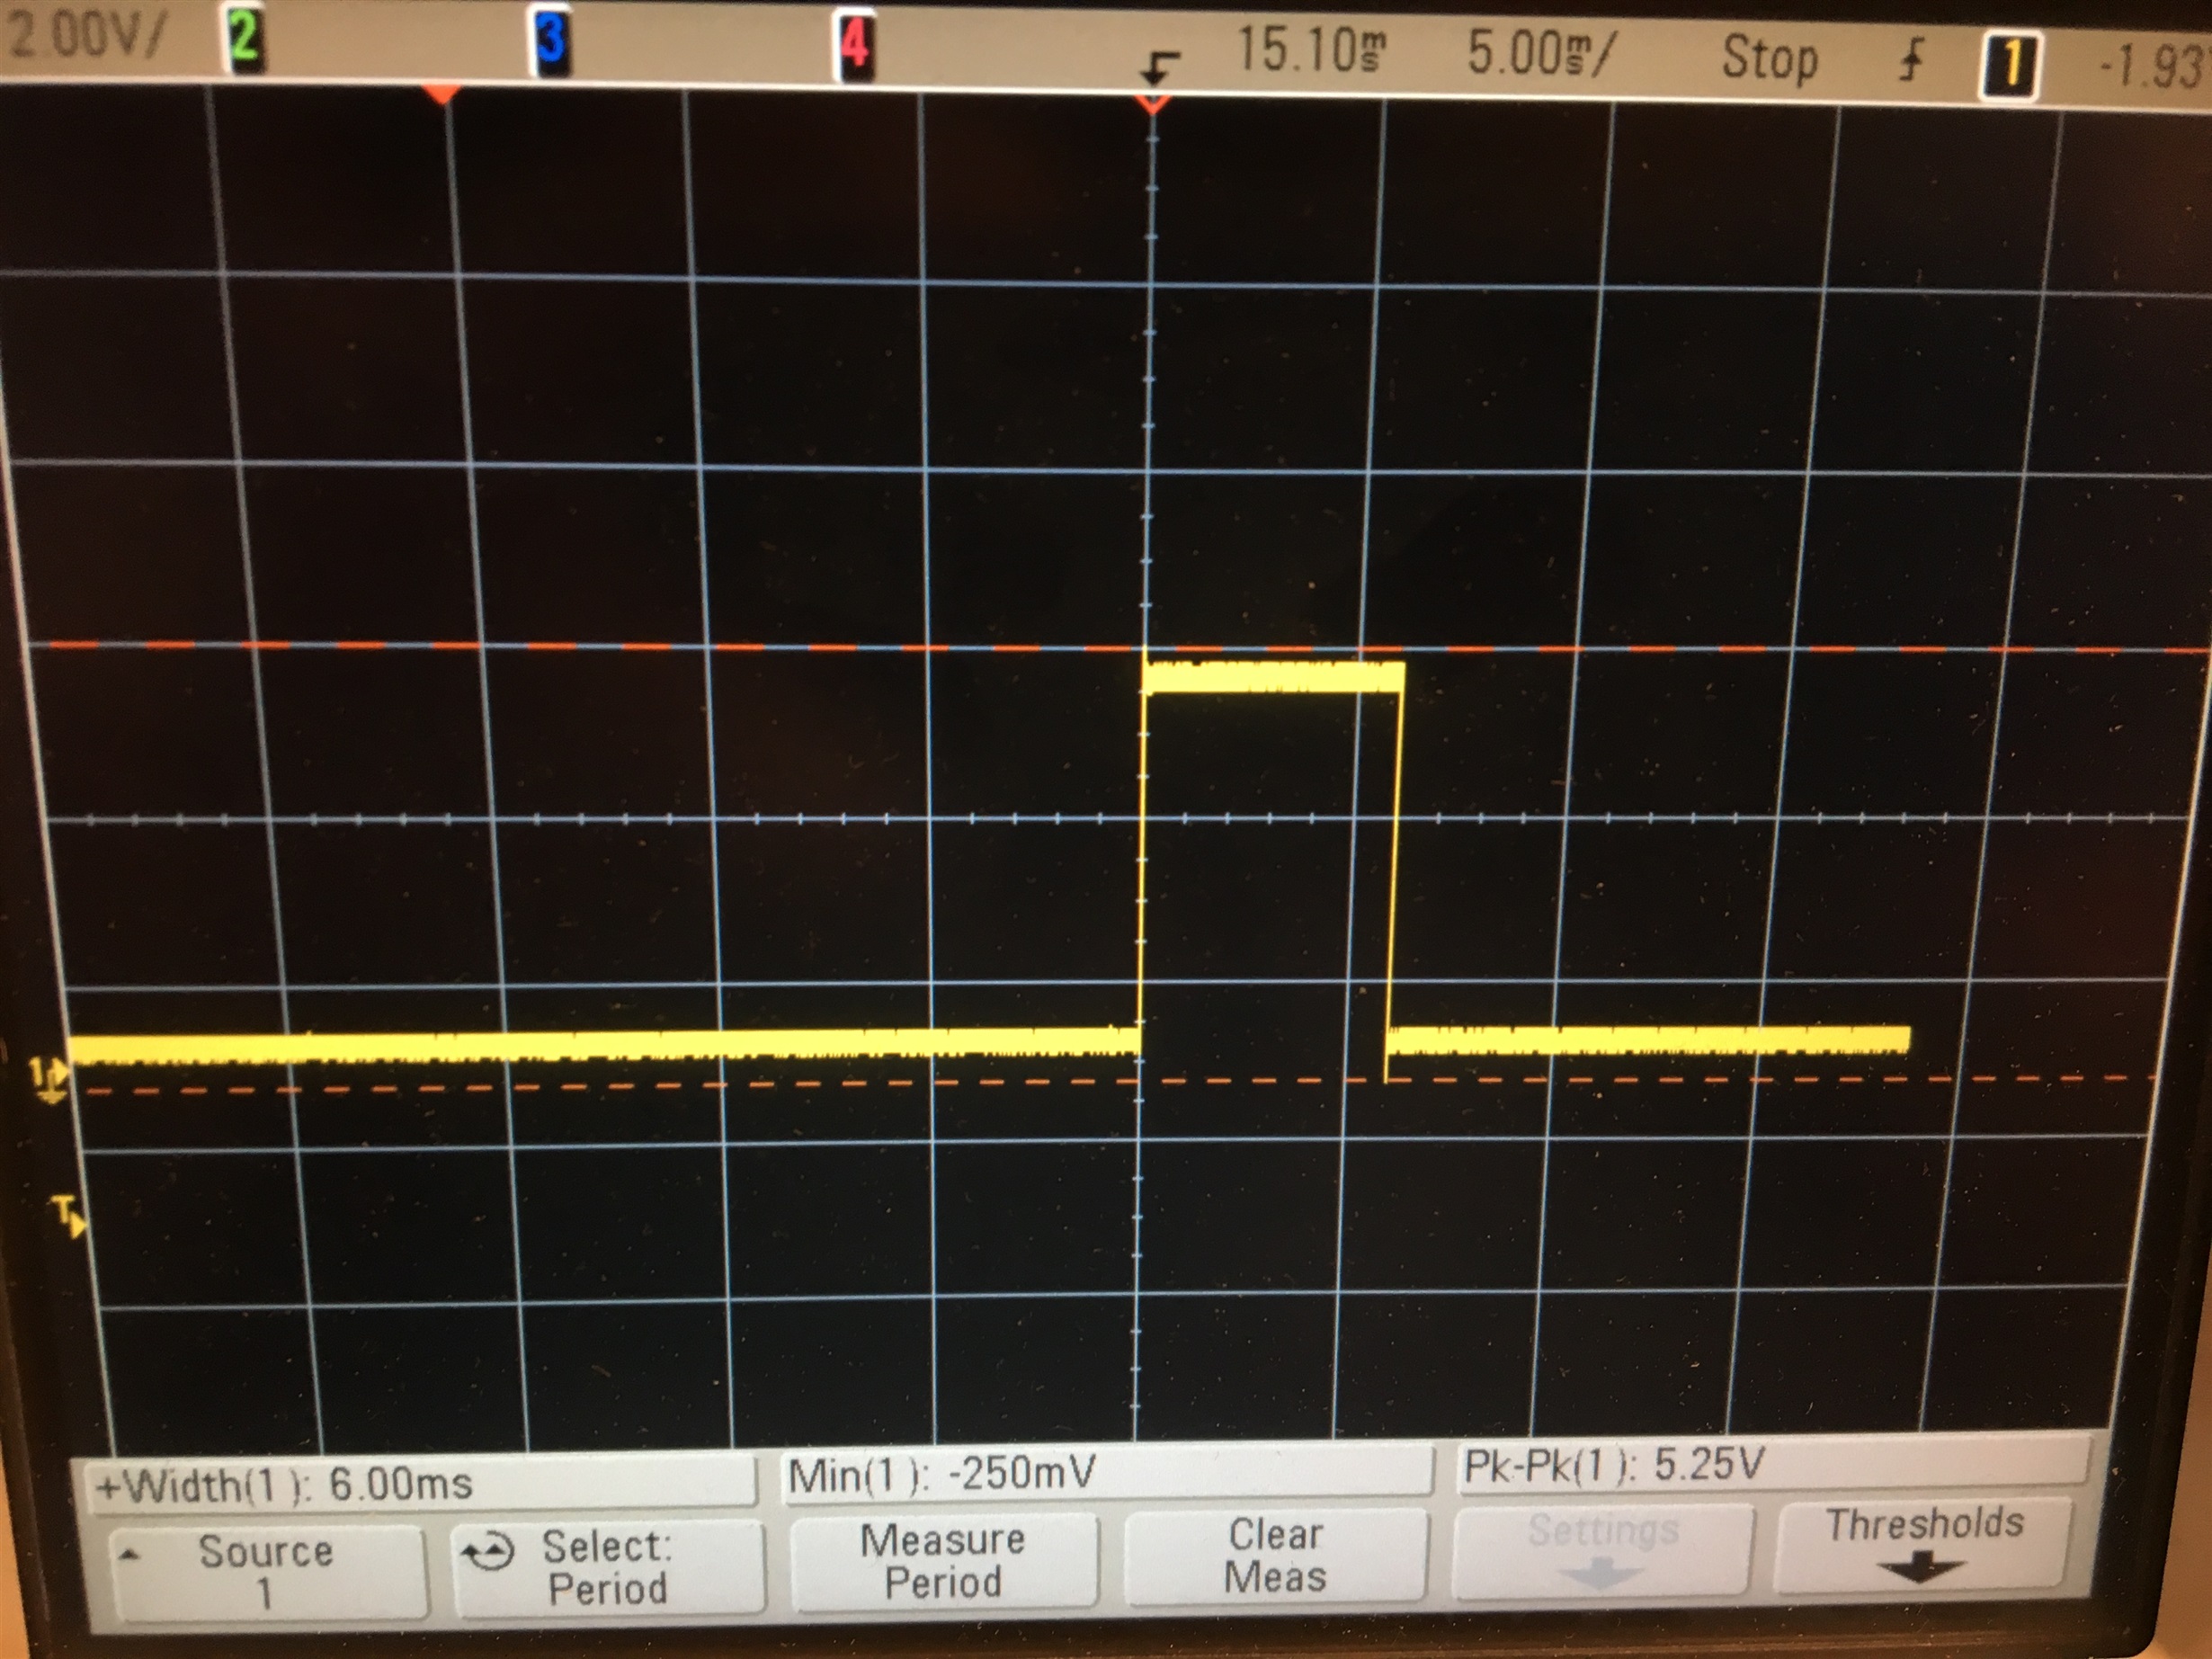
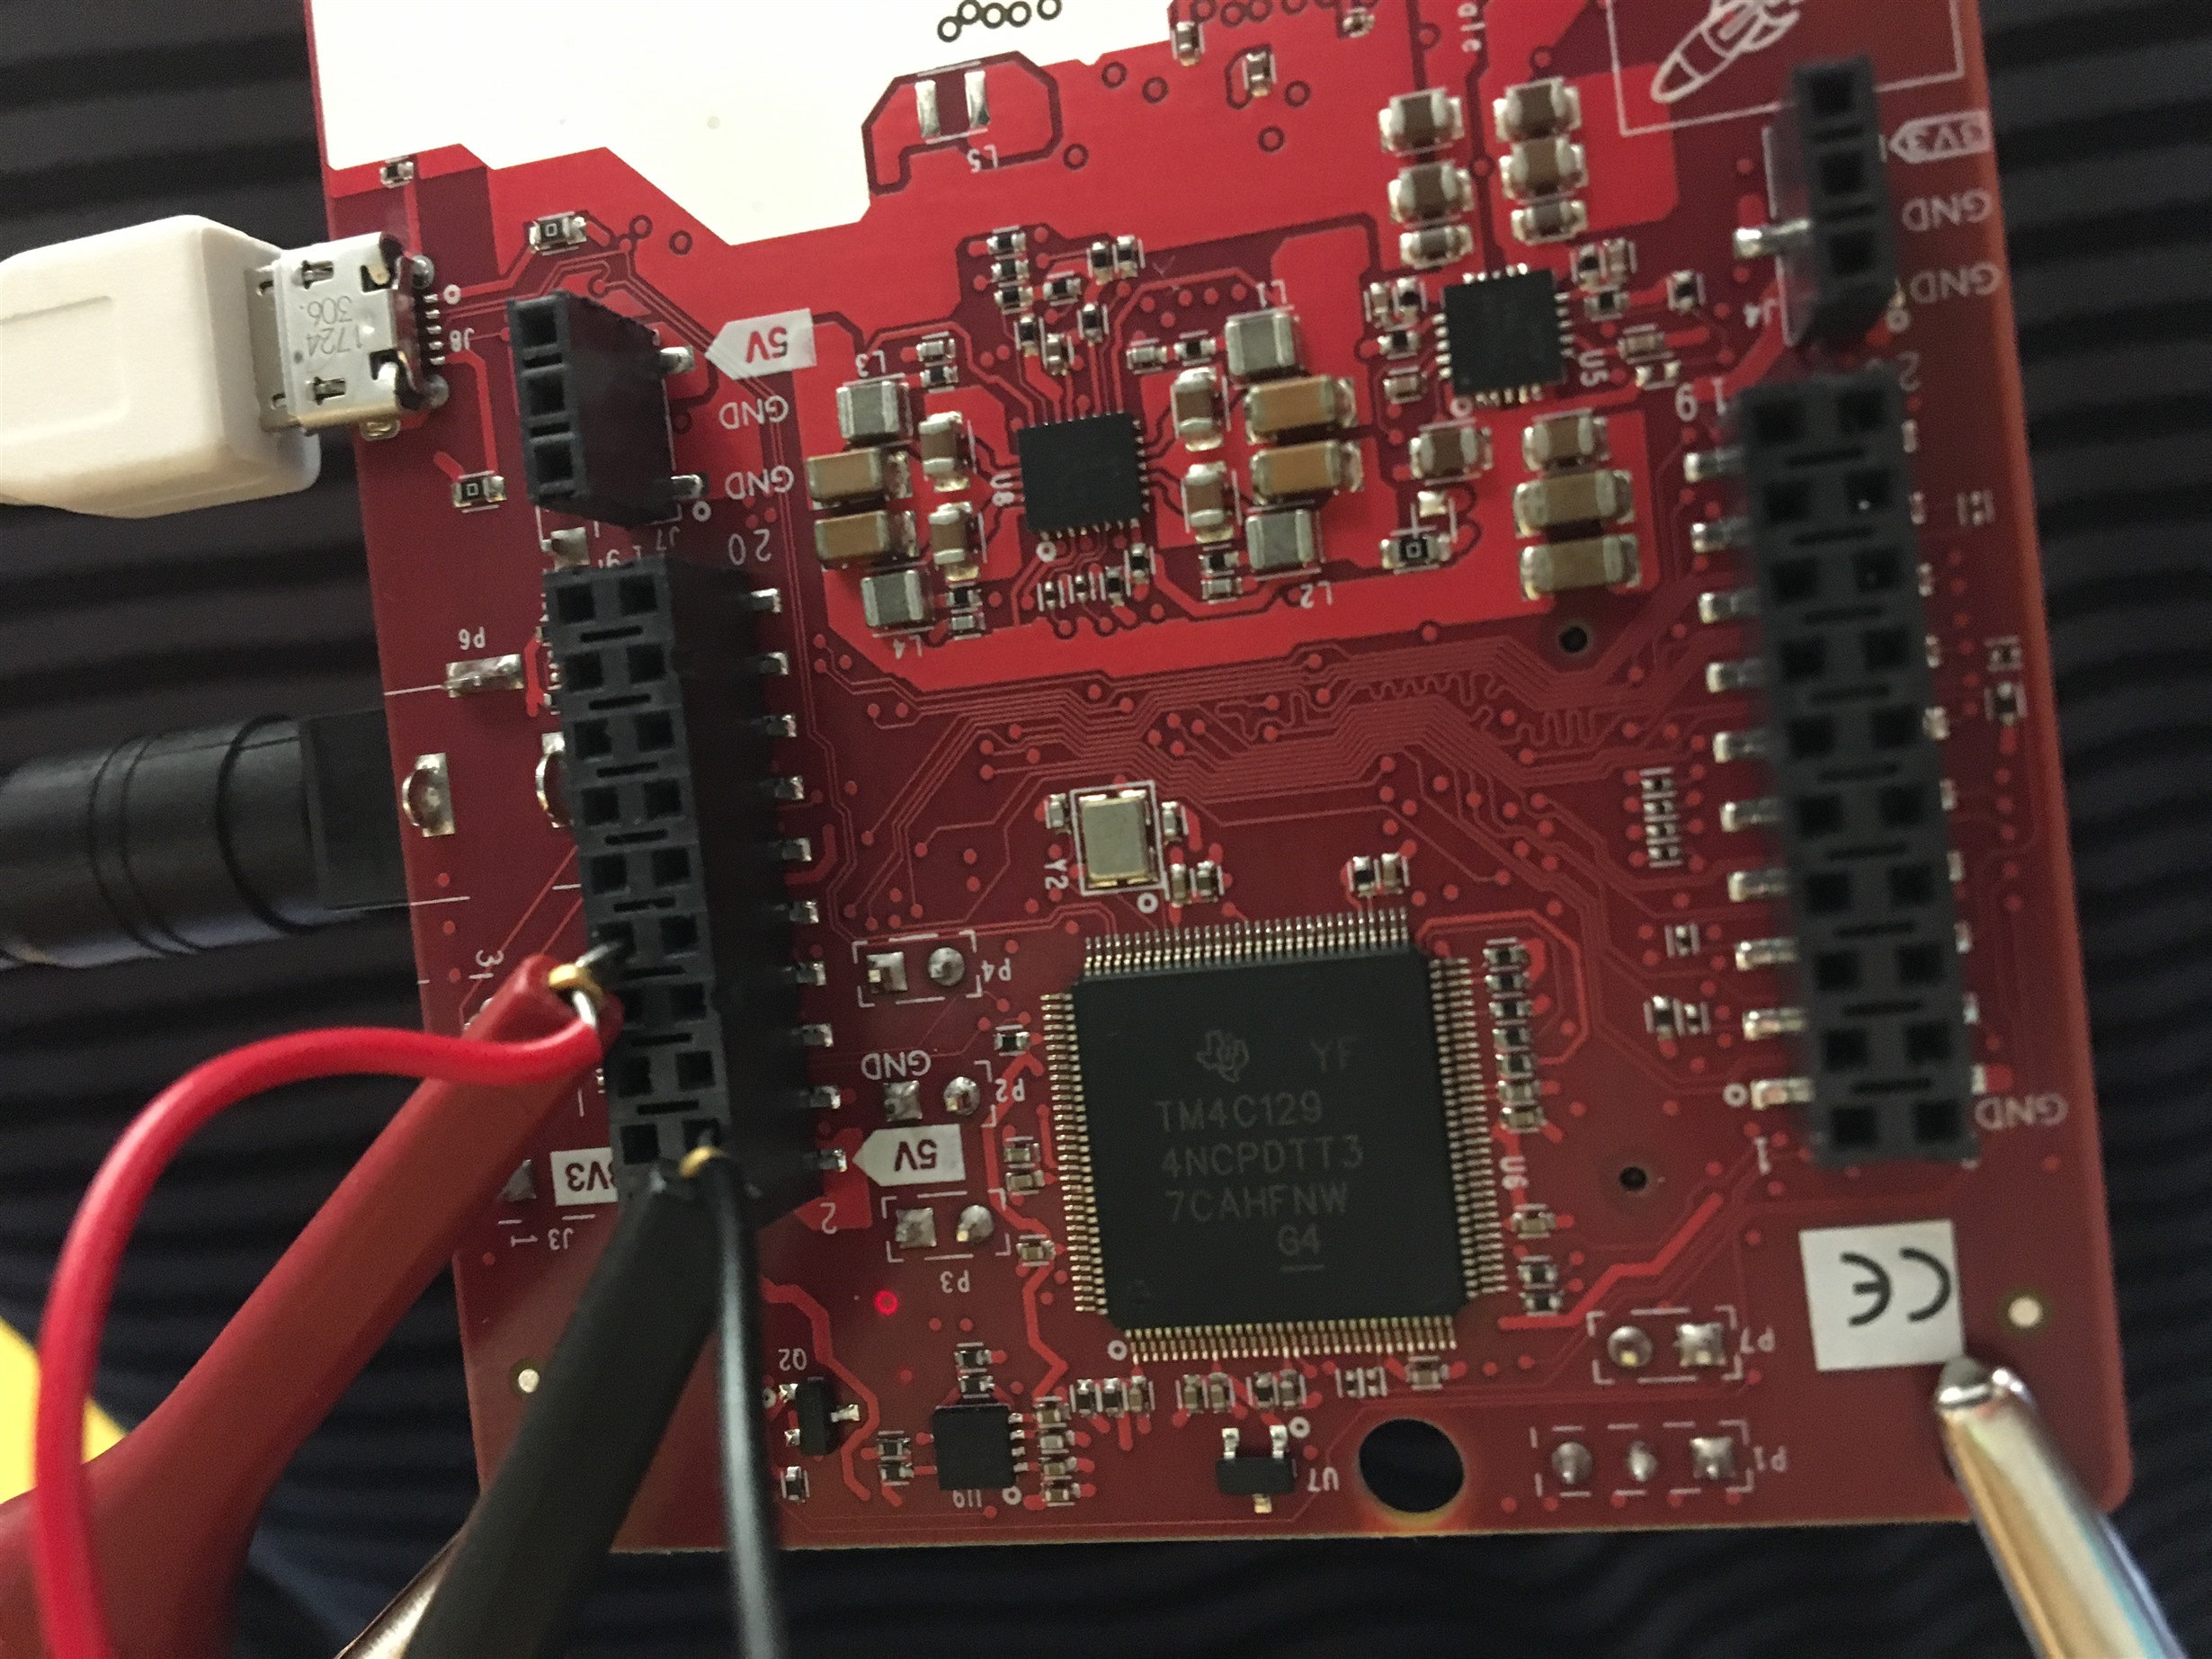
After the sensorStart command, I provided a continuous waveform to the J6-[9] SYNC_IN pin that has an high period of 6ms (active frame is ~8ms) and has a low period of 94ms (adding together to equal the 100ms frame periodicity). Still, there was no observable changes in the mmWave demo visualizer output graphs. I am not sure what I am doing wrong. Below is the verified waveform and pin connections. I appreciate your help!


