This thread has been locked.

If you have a related question, please click the "Ask a related question" button in the top right corner. The newly created question will be automatically linked to this question.

IWR6843ISK: Range Azimuth Heat Map: How to parse TLV and compute data

Part Number: IWR6843ISK

Hello Support Team,

I'm using IWR6843ISK and Area Scanner project from SDK 3.1.1.2. And here is the cfg file I use : 

I'd like to compute the same Azimuth-Range Heatmap as in OOB Demo.

I receive the TLV of the Azimuth-Range Heatmap but I have somme issues of understanding it and computing the data.

  • When I have a A-R HeatMap TLV (Type=4), the length of the TLV is equal to 4096. But using the formula of the document mmw Demo Data Structure v0.1 : Size= #RangeBins * #VirtualAntennas * 4 (bytes)

Because of my conf, I have 4 RX and 3 TX, so I would say 12 Virtual Antennas. But do I have to include the Elevation Antenna in the computation of the Virtual Antennas ? 

And number of Range Bins is equal to the smallest power of 2 greater or equal to numADCSamples, so 512.

Therefore I should expect 512*4*12=24 576, so I think I've missed something.

Could you help me understand this difference and what are the next steps of processing those data? I'm currently working with the source code of the OOB Demo but I don't understand it very well.

Thanks a lot !

Quentin.

  • Former Member
    0 Former Member

    Hello Quentin,

    Here is a code snippet to parse the heatmap

    % range-azimuth static heat map, this is a 2D FFT array in range direction (x[numRangeBins][numVirtualAntAzim]), at doppler index 0, sized to azimuthStaticHeatMapSize elements of type cplx16ImRe_t
    function [Q, Qcorr, q] = getAzimuthStaticHeatMap(payload, numTxAzimAnt, numRxAnt, numRangeBins, numAngleBins, nearEndCorr)
        [r c] = size(payload);
        if(r<c)
            payload = payload';
        end
        
        numVirtualAntenna = numTxAzimAnt * numRxAnt;
        q = payload;
        q = q(1:2:end)+q(2:2:end)*256;
        q(q>32767) = q(q>32767) - 65536;
        q = 1j*q(1:2:end)+q(2:2:end); %Imaginary first, real second
        q = reshape(q, numVirtualAntenna, numRangeBins);
        
    
        Q = fft(q, numAngleBins);
    
        %Near field corrected
        q1=q;
        q2=q;
        q1(5:8,:) = 0;
        q2(1:4,:) = 0;
        Q1 = fft(q1, numAngleBins);
        Q2 = fft(q2, numAngleBins);
        Qcorr = Q1 + Q2.* nearEndCorr;
    
    return

    Best,

    Amanda

  • Hello Amanda,

    Thanks a lot for this code snippet !

    I test it and I come back to give you feedback,

    Have a great day,

    Quentin.

  • Hello again !

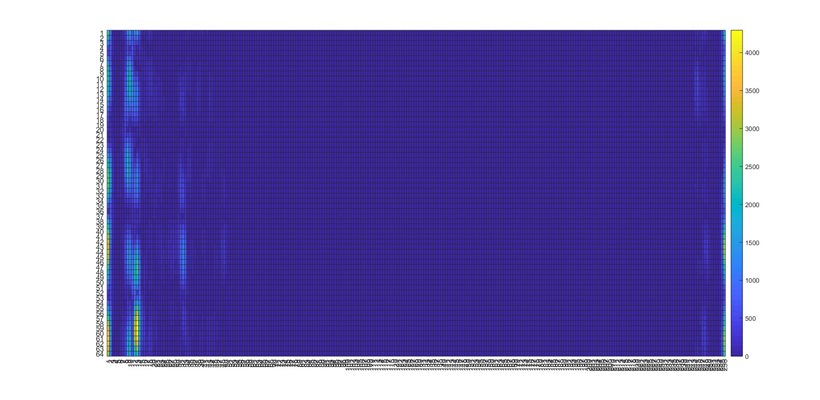
    I managed to add the code snippet in my visualizer. I used numRangeBins=256, numAngleBins=64 but I don't know why those parameters are working in theory.

    After computing magnitude of the Q matrix, I get the following HeatMap:

    Am I write saying we can see here what each RX antena "receive" ?

    From those data, could I create a HeatMap like in OOB Demo ? (in polar coordinates, or not, but global)

    Thanks for your help !

    Quentin.

  • Former Member
    0 Former Member in reply to Quentin BAJOT
    Hello Quentin,

    % plot single frame of azimuth static heatmap if(~isempty(frame(frameIdx).azHeatmap)) figure('Name','Azimuth Static Heatmap') Q = frame(frameIdx).azHeatmap.Q; NUM_ANGLE_BINS = size(Q,1); theta = asind([-NUM_ANGLE_BINS/2+1 : NUM_ANGLE_BINS/2-1]'*(2/NUM_ANGLE_BINS)); range = rangeBin2Meters; posX = range' * sind(theta'); posY = range' * cosd(theta'); xlin=linspace(-floor(range(end)),ceil(range(end)),200); ylin=linspace(0,ceil(range(end)),200); [X,Y]=meshgrid(xlin,ylin); QQ = fftshift(abs(Q),1); QQ=QQ.'; QQ=QQ(:,2:end); Z=griddata(posX,posY,QQ,X,Y,'linear'); hAzimuthHeatmapPlot = surf(xlin,ylin,Z); shading INTERP view([0,90]) axis('equal') axis([-ceil(range(end)) ceil(range(end)) 0 ceil(range(end))]) xlabel('Range X-Axis [m]'); ylabel('Range Y-Axis [m]'); titleStr = sprintf('Frame %d, Azimuth Static Heatmap', frame(frameIdx).header.frameNumber); title(titleStr) end

    Here's a snippet to plot a similar heatmap as in OOB.

    Amanda

  • Thanks a lot Amanda,

    It works perfectly !

    Have a nice day,

    Quentin.