This thread has been locked.

If you have a related question, please click the "Ask a related question" button in the top right corner. The newly created question will be automatically linked to this question.

AWR1642BOOST: TLV data for range profile / Demo Visualizer

Part Number: AWR1642BOOST

Hi together,

after analyzing the TLV type 2 (MMWDEMO_OUTPUT_MSG_RANGE_PROFILE ) data that is transmitted via UART, I have the following questions:

1. To what exactly are these values relative to? As they are labeled "power", can I somehow assign absolute mW/dBm values to the peaks?

2. Is the data obtained by one or multiple (virtual) receive antennas? If the latter one, how is it guaranteed that an object on the side is not "smeared" over distance as a consequence of different path distances?

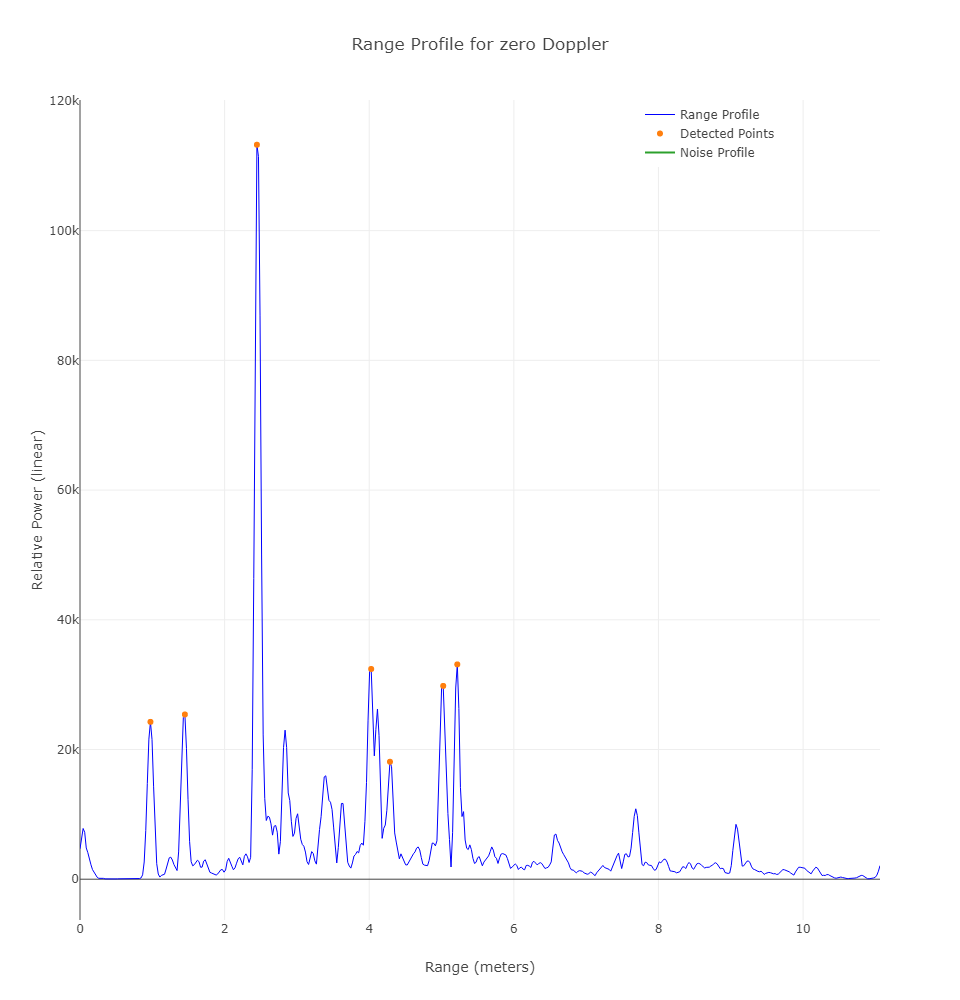
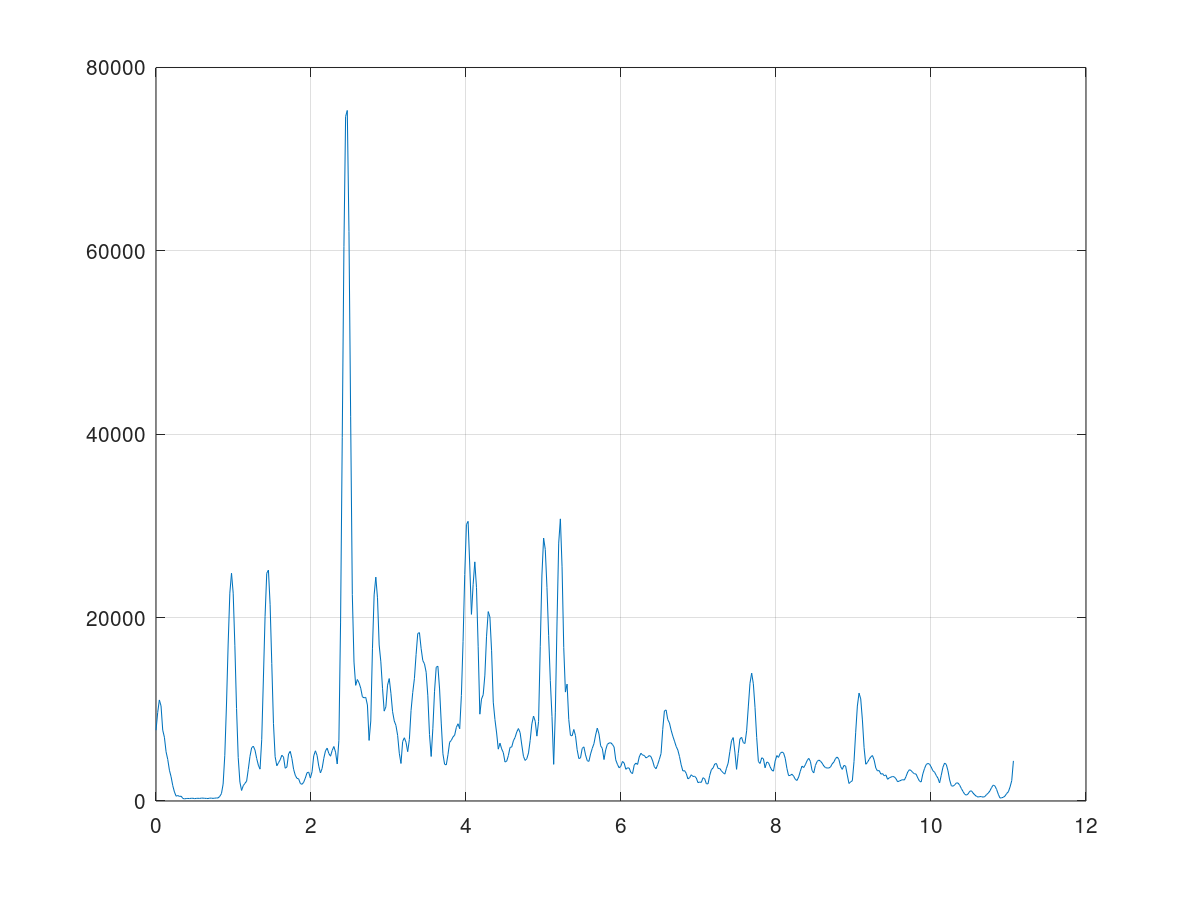
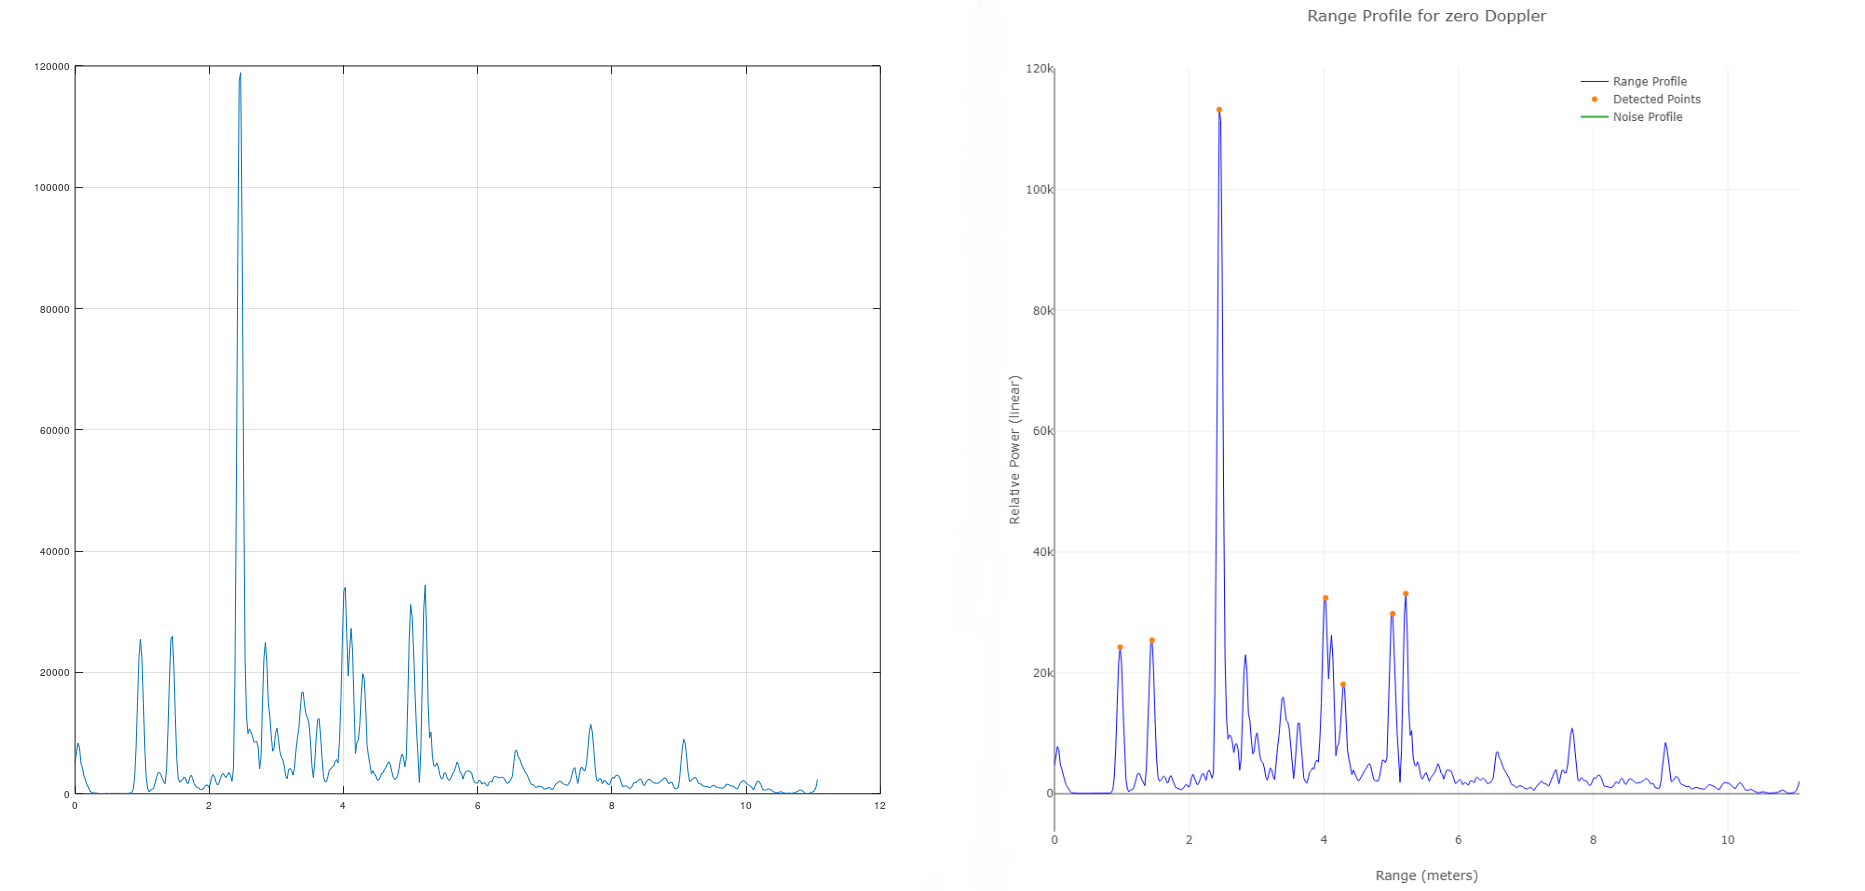
3. I tried to plot the TLV data, but this results in different values than the ones the Visualizer is depicting. As you can see below, while the first two peaks have almost identical values in both plots, the largest peak has a value of more than 110k in the Visualizer's plot and less than 80k in my own plot. Where could this difference come from?

  • Regarding the MMWDEMO_OUTPUT_MSG_RANGE_PROFILE TLV, the following information is provided in the SDK Out-of-Box Demo Doxygen:

    Range profile
    Type: (MMWDEMO_OUTPUT_MSG_RANGE_PROFILE)

    Length: (Range FFT size) x (size of uint16_t)

    Value: Array of profile points at 0th Doppler (stationary objects). The points represent the sum of log2 magnitudes of received antennas expressed in Q9 format.

    For more information regarding Q format, please refer to the following links:

    http://www.ti.com/lit/an/spra109/spra109.pdf

    https://en.wikipedia.org/wiki/Q_(number_format)

    Regards,
    Kyle

  • Hi Kyle,

    thanks for your reply, but I have no issues with the Q format used and your post doesn't answer a single question I raised. Please go through my original post once again and try to understand the problems described there in order to give a more helpful reply.

    Best regards

  • With regards to one of your earlier questions, in the Out-of-Box Demo, all four RX antennas are enabled, so the data is obtained by all four receive antennas. 

    Can you show how you are parsing the TLV file and plotting the output?

    Regards,
    Kyle

  • Hi Kyle,

    thanks for your reply. Sticking to my original order:

    1. What exactly are the range profile values relative to? As they are labeled "power", can I somehow assign absolute mW/dBm values to the peaks?

    2. As I understand, the range profile depicts the zero-Doppler column of the detection matrix. According to the doxygen, measurements from multiple Rx antennas are then summed non-coherently, meaning, objects might be smeared over adjacent range bins due to differences in path distances. Please confirm or correct.

    EDIT: Not detection matrix but radar cube. Still, this would leave two dimensional data, the range bins over the virtual Rx channels.

    3. I parsed the TLV file using a C#-script. After extracting the length of the TLV-item, i simply ran the following loop:

    UInt16 rp = System.BitConverter.ToUInt16(tlv_file, byteIndex);
    byteIndex += 2;

    I am very confident the data I get out there is correct. Subsequently, I read in the data in Octave and plot it. Originally, I just divided each value by 256 to convert from Q9 to float, which resulted in the plot seen above in my original post. However, I noticed that the Visualizer performs a comprehensive amount of processing on the values before plotting, maybe you can elaborate on why this is done? For example, I allude to the dspFftScalComp-functions.

    EDIT: I can see that this is also a topic in https://e2e.ti.com/support/sensors/f/1023/t/821420. TI, please comment on this.

    Nevertheless, I was able to plot the following, which is now closer to the Visualizer's plot, but not yet perfectly matching (Octave plot based on parsed TLV data and translated Visualizer source code on the left, original Visualizer plot on the right). As you notice, my own plot now gives values slightly larger than the ones depicted by the Visualizer.


  • Hi,

    any news on this topic? Currently, I think about measuring the "relative power" of a corner reflector with known RCS to have a reference value. Is this a viable option?

    Best regards

  • Dear TI support team members,

    please take your time to answer these utterly straight-forward questions:

    1. To what exactly are the range profile values relative to? As they are labeled "power", can I somehow assign absolute mW/dBm values to them?

    2. Is it possible to use a corner reflector with known RCS for calibration to have a reference value? Like, if that reflector should produce a certain receive power P_1 at the radar according to the radar equation, and it is displayed in the range profile (or as an SNR side info) with power P_2, can I "measure" any receive power P_x displayed in the range profile using the relation P_1/P_2 ?

    3. WHY is the processing of the TLV data in the Visualizer done the way it is? Or, equivalently, what is the physical meaning of the TLV data? Please refer to point 3. in above posts for more information.

  • Hi,

    Sorry for the delay.

    Questions #1

    Please see

    https://e2e.ti.com/support/sensors/f/1023/t/608465

    Question #2

    http://e2e.ti.com/support/sensors/f/1023/t/785208?AWR1642BOOST-How-to-compute-absolute-RCS-

    https://e2e.ti.com/support/sensors/f/1023/t/634697?How-to-calculate-RCS-

    http://e2e.ti.com/support/sensors/f/1023/t/779825?AWR1642BOOST-RCS-computation

    Question #3

    As you mentioned, the visualizer performs scaling on FFT data. During FFT processing on the DSP, the data is scaled to avoid overflow. My understanding is tha the visualizer compensates for that

    thank you

    Cesar

  • Hi Cesar,

    thanks for your reply!

    1. I understand the motivation of this relative scale, however, it's a bit unsatisfying that there exists no direct relationship between the process output data and the measured input data.

    2. None of the posts you linked to speaks about the usage of a corner reflector for calibration, but they give a rough idea that this might actually work. In the mean-time, your colleague Vivek feels confident about this as well, see https://e2e.ti.com/support/sensors/f/1023/t/837507.

    3. This makes sense, thank you.

    I'm still a little confused as to why my implementation of the Visualizer code produces values differ slightly from the ones the Visualizer depicts (see my post from Aug 19, 2019), but for now I feel content with the answers and my knowledge gained from them. You can close this thread if you wish.