Hi,
when i have samples and i want to make a range profile. How to i calculate the axis of the graph?
What i did till now is
1) calculate the absolute value of the fft of complex values for y-axis
2) plot the data as such .
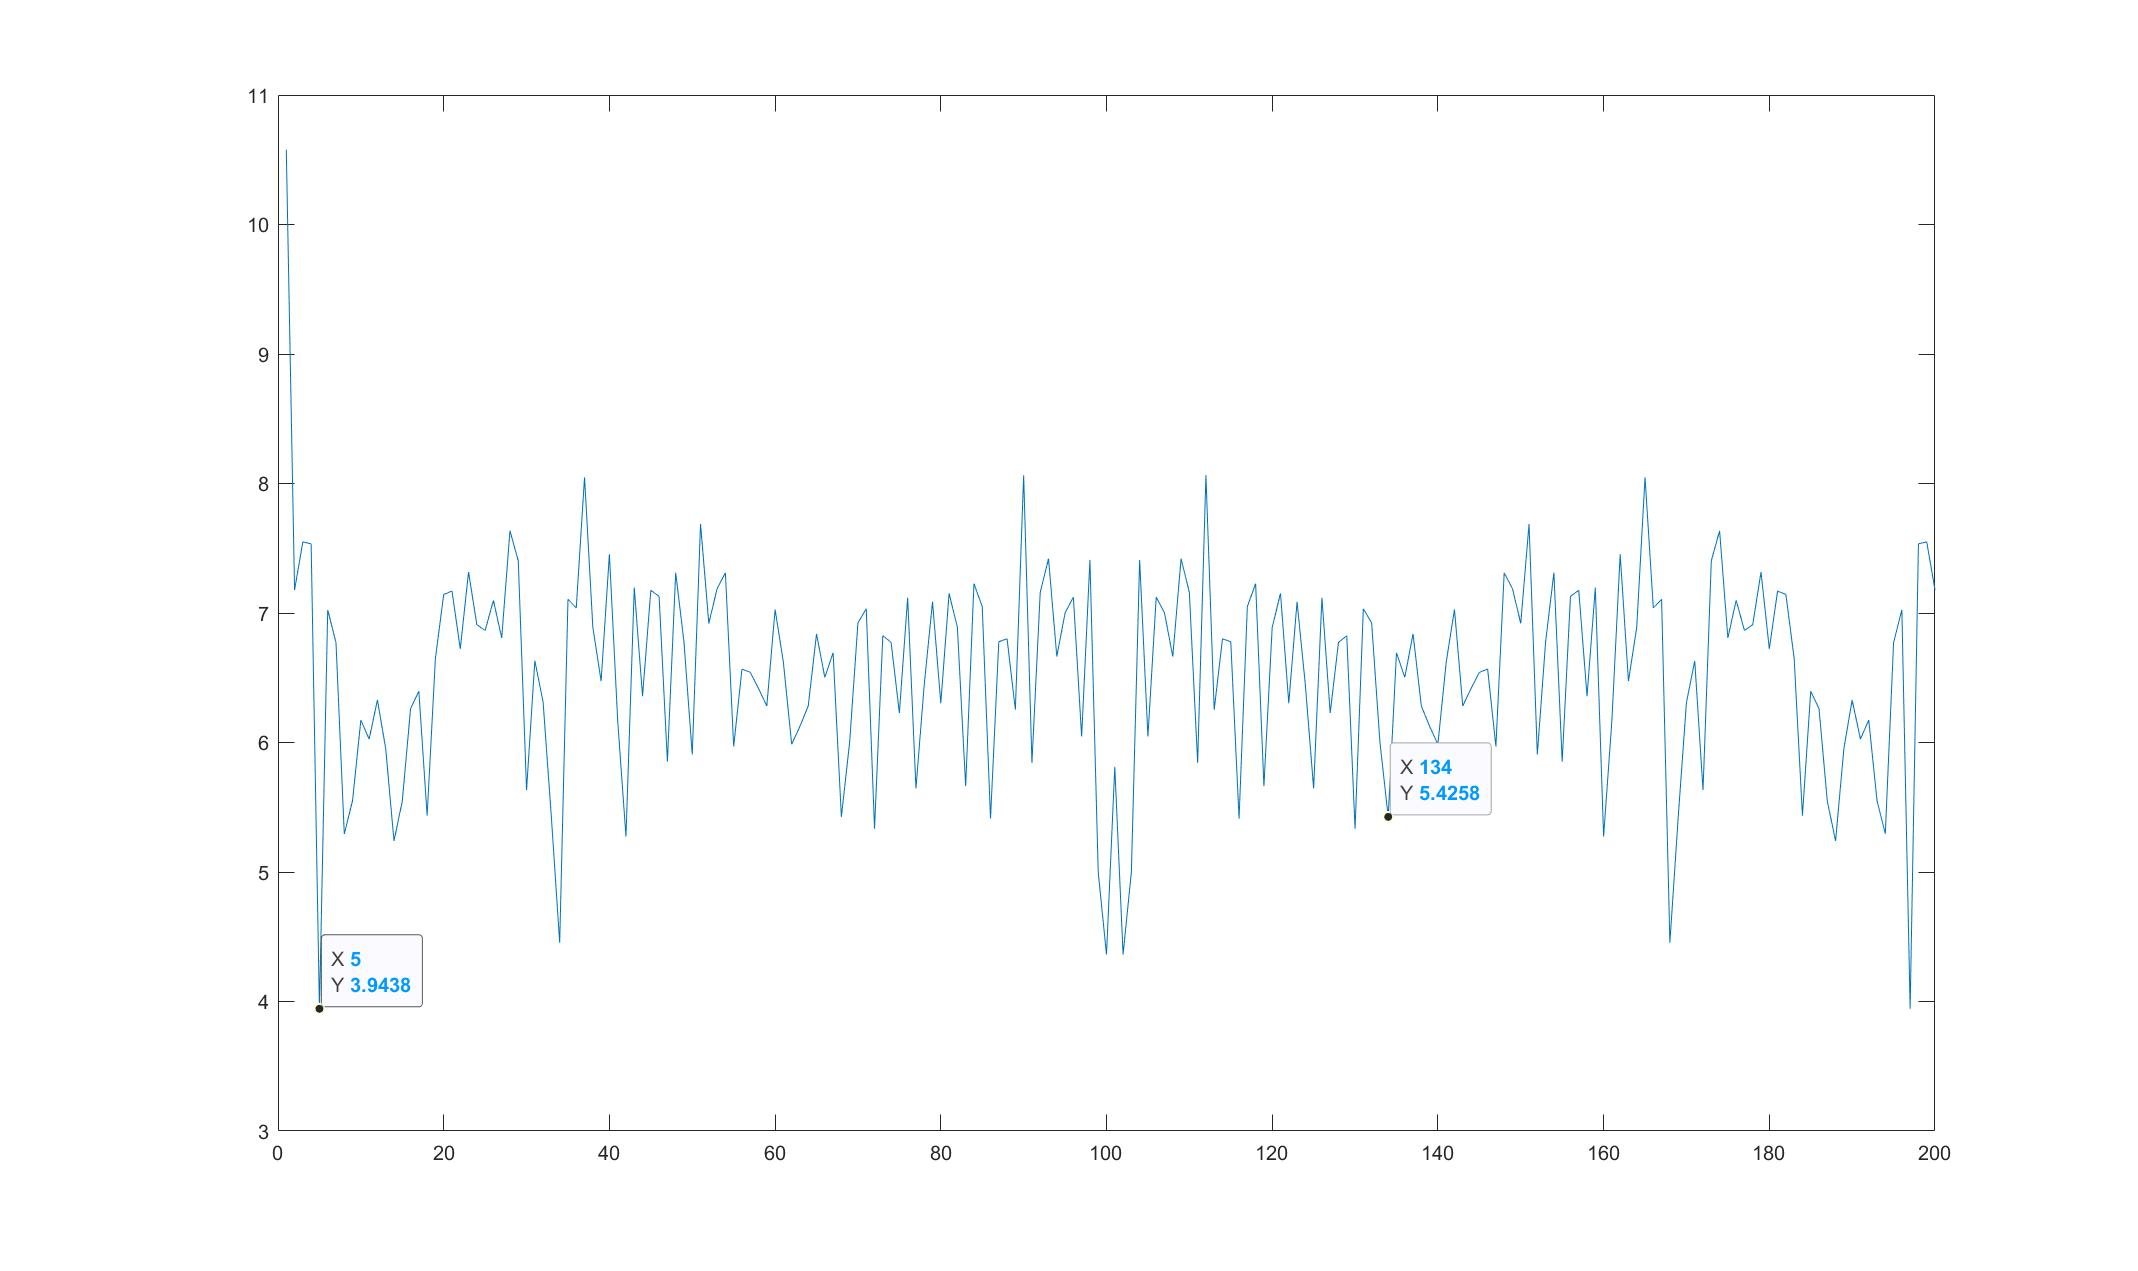
However i get this graph. This is a graph over 200 samples. i configured my range between 0.3m and 2m..
I need an x-axis, that only goes between 0.3 and 2. How do i calculate the rangebin relative to each sample.


