Tool/software:
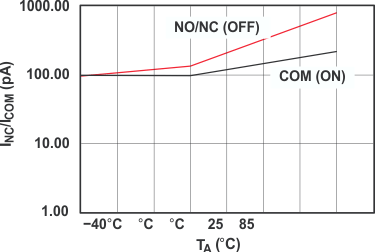
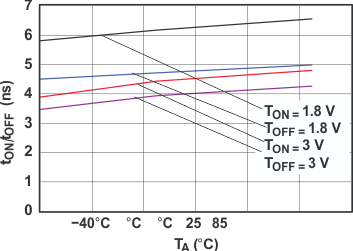
このデータシートの図4および図7の-40°C、+25°C、および+85°Cのラインの位置を教えてください。
温度表示が壊れています。
温度表示が壊れています。
This thread has been locked.
If you have a related question, please click the "Ask a related question" button in the top right corner. The newly created question will be automatically linked to this question.


Only three measurements were done, at these three temperatures. So −40 °C and 85 °C are at the left and right ends of the lines; 25 °C is where there is a kink.
In older datasheet revisions, the placement of the temperature labels was obviously wrong:

