


Fig 2 of TS5A9411 shows Charge Injection versus Vcom. But the figure shows Vcom extending to about 18V; but the absolute max for Vcom is 6V.
Is this the correct figure for this part?
Is one or more axis labeled incorrectly?
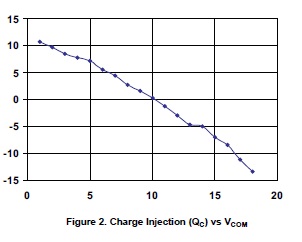
Fig 2 of TS5A9411 shows Charge Injection versus Vcom. But the figure shows Vcom extending to about 18V; but the absolute max for Vcom is 6V.
Is this the correct figure for this part?
Is one or more axis labeled incorrectly?
