This thread has been locked.

If you have a related question, please click the "Ask a related question" button in the top right corner. The newly created question will be automatically linked to this question.

Debugger: How To See More Than 3 Levels In Call Stack

Hello,

I'm using CCS 10.2.0.00009 with F2837x controlCARD R1.3 connected via XDS100v2.

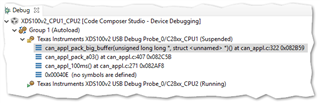
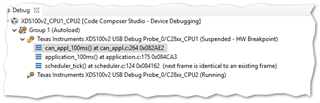
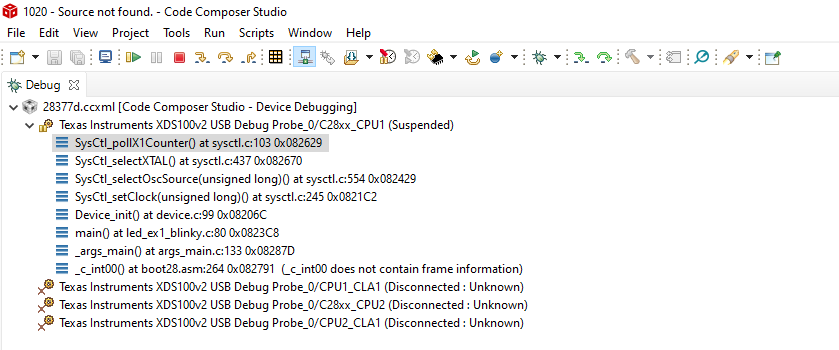
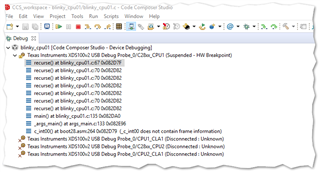
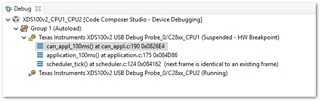
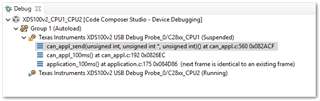
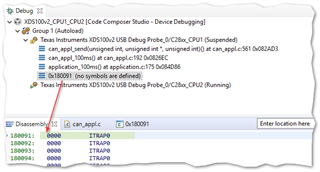
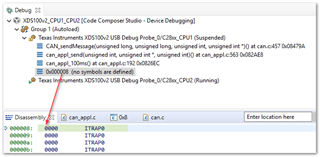
It seems that the call-stack displayed in the debugger is only ever 3 three levels deep. How can I see more than that please?

Thank you.

  • Hello,

    The call-stack can go beyond three levels. If you only see three levels, but feel that there should be more displayed, it could be an issue with the loaded debug symbols or the debugger itself. If you do feel there is some issue, can you take a screenshot of the debug view and provide it here?

    Thanks

    ki

  • Thanks Ki. Here's an example:

    Source code call hierarchy:

    But the debugger shows only this:

    If I move the breakpoint up the hierarchy then more levels are revealed which I think I should see in the previous screenshot shouldn't I?

  • As long as all the debug symbols are available, there should be no theoretical limit. See the example below for my example program running on an F28377D controlCARD via XDS100v2 on CCS 10.2.0:

    The call stack is already 8 deep. I have optimization off and with full debug symbols.

    Can you provide a test case that can reproduce the issue, where all debug symbols are available but the call stack information is truncated?

    Thanks

    ki

  • Thanks Ki, it's good to know there's no intentional limit.

    Unfortunately I have to use COFF as the basis for our project, it's a long story. Would that have an impact?

    Anyway, I will construct a test case asap.

  • I made a COFF blinky project with a recursive function and can see many call stack levels as you describe.


    The issue just seems to be with my actual project so I can't easily give a simple use case.

    If I stop here I get 3 levels:

    If I step into the next function I get three levels:

    If I step into again, I get three meaningful levels plus a fourth level showing the PC at some arbitrary location without a meaningful instruction:

    Another step into and yet another arbitrary disassembly location:

    It is arbitrary but not random. Starting the program again yields exactly the same address pattern. 0x180091 then 0x000008.

    My program runs fine so the stack contents must not be corrupted. It seems the debugger, in this particular circumstance, does not interpret the stack correctly.

    Any ideas how I can investigate the root cause myself please?

  • The bottom entry of the call stack in the above screenshots has the message: 

    The issue just seems to be with my actual project so I can't easily give a simple use case.

    If I stop here I get 3 levels:

    If I step into the next function I get three levels:

    "next frame is identical to an existing frame"

    This explains why there are no other entries below that.

    As for the explanation?

    https://e2e.ti.com/support/tools/code-composer-studio-group/ccs/f/code-composer-studio-forum/875181/ccs-msp432p401r-debugging-stops-with-next-frame-is-identical-to-an-existing-frame-message/3242069#3242069

    If I step into again, I get three meaningful levels plus a fourth level showing the PC at some arbitrary location without a meaningful instruction:

    Another step into and yet another arbitrary disassembly location:

    The bottom entry of the call stack is on an ITRAP instruction. It looks like some exception occurred. This would explain why the call stack is unable to unwind any more information.

    Is your program running as expected? Or are you running into some issue (exception) and trying to debug?

    Thanks

    ki

  • Thanks Ki. Yes, as mentioned in my previous post my program runs just fine.

    I assume that an actual ITRAP0 instruction would cease execution. All the evidence so far indicates that the debugger is showing phantom program counters that aren't in reality part of the actual call stack.

    What can I look into next please?

  • What can I look into next please?

    Unfortunately I will not be able to provide much more suggestions without a test case. 

    I don't need your actual project, just something that can reproduce the issue. Perhaps a stripped down version of your project? I just need a minimal program as long as I can reproduce the issue locally.

    ki