This thread has been locked.

If you have a related question, please click the "Ask a related question" button in the top right corner. The newly created question will be automatically linked to this question.

How to simulate a DSP device using CCS ?

Hello, I'm studying Embedded Electronics and Telecommunications, and our DSP teacher asked us to make a project with CCS using simulation. He asked us to use CCS v3.1 or CCS v3.3 and provided us with some libraries and files to include in the project. More precisely : C5713dsk.cmd, c6713dskinit.c, C6713dskinit.h, csl6713.lib, dsk6713.h, dsk6713_aic23.h, dsk6713bsl.lib, rts6700.lib, Vectors_intr.asm and Vectors_poll.asm.

After installing CCS v3.3 on a Windows XP machine, I managed to build a project and get a .out file using the above libraries. What I did next is uploading the .out file to the project, and then I faced two problems:

1) When I run debug, it shows me Memory Map Error : saying that an address is used by hardware.
2) I don't know how to use the graph data ( under : view--> graph --> time/frequency)

If anyone can help with that, please answer to this!

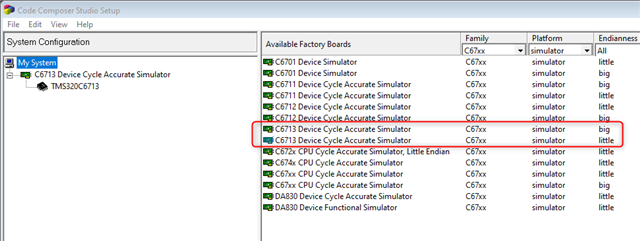
If there is any way to simulate a C6713 DSP, on any CCS version, please explain it to me!

And thanks in advance.

  • Do you have an actual 6713DSK hardware? Or are you trying to use software simulation?

    Thanks

    ki

  • Hello, thanks for responding.
    Actually I don't have an actual hardware and we are asked to perform a software simulation. The kind of projects that we are asked to perform are for example generating a sine wave and plotting the graph. I don't know how to do this if it is even possible on CCS.

  • Without hardware, you will need to use the C6713 Device simulator in CCS 3.3.

    Note that this is a device simulator and not a board level simulator. Hence if there any dependencies on the SDK itself, then your application will not work. Since your teacher said to use a simulation, perhaps it is fine. 

    As for graphing, please check the Help that comes with CCS 3.3. There should be sections on the Graph utility which will explain how to use them. 

    Note that you are using a very old and unsupported version of CCS. Hence the amount of support we can provide will be minimal.

    Thanks

    ki

  • Yes I used this simulator when I built the project. I will read the Help to see how it works. Thank you very much for your help and time.

  • In addition to the Help Contents, also check out the Tutorials (Help -> Tutorial). There is a Tutorial section on Data Visualization which covers Time/Frequency graph).

  • That should be helpful. I have one more question: How about simulation on another version (V5.5 for example) I tried this and it seems that the libraries that the Teacher have provided us with don't work there. I can't even build a DSP project there. I am really a beginner in DSP and I didn't find any courses that are helpful. If you can indicate a course, or any tutorial material on how to build a DSP project on newer version of CCS, that would be so helpful.

  • CCSv5.5 does have a C6713 simulator. The source and library files should also work with a CCSv5 project. The environments are very different. Which environment you should use should depend on the coursework. 

    If you can indicate a course, or any tutorial material on how to build a DSP project on newer version of CCS, that would be so helpful.

    I see this book referenced a lot by people getting started with the C6713:

    https://www.amazon.com/Digital-Signal-Processing-Applications-Topics/dp/0471690074

    Note that I don't have any personal experience with this book.

    You may want to try posting in the Processors forum for more suggestions. The experts there can provide more suggestions

  • All right, I would like to thank you again for your time. I will try with both version and see which will work for me.

  • The book you recommended was like a treasure. It really contained all what I was looking for.
    I managed today to make the simulation, It will work fine as long as you don't use comm_poll() or comm_intr(), and output_sample() or any other input/output function. I was generating a signal so I used only an output buffer to store data. And using the graph I managed to plot the signal.