Other Parts Discussed in Thread: AWR1843
Hello,
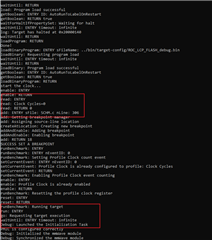
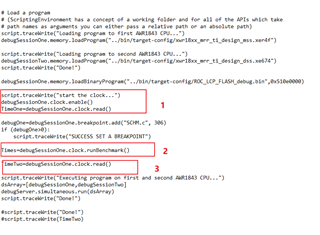
I use AWR1843, XSD110 debugger and ccs software to build a debugging environment, and use python to write scripts to call the methods in the DSS interface to achieve automated testing. The target board stops when it hits a breakpoint, but I want it to continue to run to the next breakpoint, then calculate the execution time of the code between the two endpoints. I call the clock timer API before the breakpoint, and read the clock value, the clock.runBenchmark API is called after the breakpoint. After calling the clock.runBenchmark API, the clock value is read again. The final result of the operation is that the first time the clock value is read as 0, the second time the clock value cannot be read, why is this, the order or method of the relevant interface calls right? Screenshots of the script and the final running result are as follows: