This thread has been locked.

If you have a related question, please click the "Ask a related question" button in the top right corner. The newly created question will be automatically linked to this question.

CCS/AWR1843

Other Parts Discussed in Thread: AWR1843, AWR1642, AWR2944

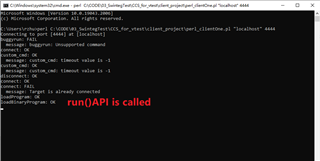
Hello KI, I am using AWR1843, XSD110 debugger and ccs software to build a debugging environment, and when I call the API to write a script to implement automated testing, I find that if I call the run() API, the target board can run successfully, the indicator light will flash, but the control will not be returned to the host application/script, and any operations following the run() command will not be executed, making the program unable to perform other operations. If the runAsynch() API is called, the control can be returned to the host application/script, and the operations after runAsynch() will be executed, but the AWR1843 target board will not be able to run successfully, the indicator light will not flash, if the timeout setting is added, it will display the target board fails to run, why is this? Is there any API that would allow the target board to run successfully, blink the lights and return control to the host application/script? The following are the execution results and script documentation, can you help? thank you very much!
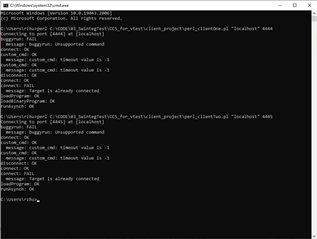
BEGIN {
	# Add the @INC path the directory where the DSSClient module is found.
	push (@INC, "dss");
}
use strict;
use warnings;
use DSSClient;

if (scalar(@ARGV) != 2) {
    die "Usage: perl perl_client <local host> <port number>\n";
}

my $host = $ARGV[0];
my $port = $ARGV[1];
#my $portTwo = $ARGV[2];

my $client = new DSSClient($host, $port);
my $cmd = undef;
my $result = undef;

# Connect to the CCS json server.
$client->open();

#Send commands to DSS Test Server
#----------------
# This command does not exist and should FAIL.
$cmd = {
	"name" => "buggyrun",
};
execute_command($cmd);

# Connect to the target.
$cmd = {
	"name" => "connect",
};
execute_command($cmd);

# Demonstrate the use of custom commands (report current timeout value)
$cmd = {
	"name" => "custom_cmd",
};
execute_command($cmd);

# Demonstrate the use of custom commands (report current timeout value)
$cmd = {
	"name" => "custom_cmd",
};
execute_command($cmd);

# Disconnect from the target.
$cmd = {
	"name" => "disconnect",
};
execute_command($cmd);

# Connect to the target.
$cmd = {
	"name" => "connect",
};
execute_command($cmd);

# Connect to the target.
$cmd = {
	"name" => "connect",
};
execute_command($cmd);

# Load program.
$cmd = {
	"name" => "loadProgram",
	"program" => "C:/Tool/JPython/bin/target-config/xwr18xx_mrr_ti_design_mss.xer4f",
};
execute_command($cmd);

# Load program.
# $cmd = {
# 	"name" => "load",
# 	"program" => "C:/Tool/JPython/bin/target-config/xwr18xx_mrr_ti_design_dss.xe674",
# };
# execute_command($cmd);

# Load program.
$cmd = {
	"name" => "loadBinaryProgram",
	"program" => "C:/Tool/JPython/bin/target-config/ROC_LCP_FLASH_debug.bin",
	"address" => "0x510e0000",
};
execute_command($cmd);

# Execute program.
$cmd = {
	"name" => "runAsynch",
};
execute_command($cmd);

# We are done now.

$client->close();

#------------------

# execute command
sub execute_command
{
    $result = $client->execute($_[0]);
    
    if (defined $result) {
        print "$_[0]{name}: ". $result->{"status"} . "\n";  
        # If there is a message, print it
        if (exists $result->{"message"} ) {           
        	print "  message: " . $result->{"message"} . "\n";
        }
        # If a value was returned, print it
        if (exists $result->{"value"} ) {           
        	print "  value: " . $result->{"value"} . "\n";
        }
    } else {
        print "$_[0]{name} execution failed\n";
    }
}

  • Yeah, that's what we do. We adjust the clock properties to auto-reset before each run.

  • Ok, yes then it should be the cycle count between the two breakpoints

  • Hi Ki, I found the clock cycle count values obtained by two ways differ greatly on CCSIDE. The first way is connect target ,add  breakpoint before run target.The second way is connect target ,then let target run for a period of time,after that pause the target ,add breakpoint and run target again.Which way is more accurate? If I call run() API in the script to make the target run first, it is sad that target does not return control, so i can't pause it ,add breakpoint and run it again. it seems that i only  can call add.breakpoint() API firstly then call run() API , right?Should i call halt() API if i want pause the target when it is running and call run() API again after pause it?

  • I read some official script examples about using APIs,  and i have some questions hope you can help me answer them. Thank very much!

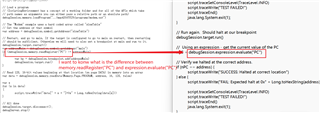
    I can't quite tell the difference between the three API:

    debugSession.symbol.getAddress("ReadNextData")

    debugSession.memory.readRegister("PC")

    debugSession.expression.evaluate("PC")

    Three APIs all seem to be getting address value,What are the differences among address value obtained by three APIs?

    If i want to read global variable and change its value,i should use memory.readData() and memory.writeData(), right?

  • I found the clock cycle count values obtained by two ways differ greatly on CCSIDE. The first way is connect target ,add  breakpoint before run target.The second way is connect target ,then let target run for a period of time,after that pause the target ,add breakpoint and run target again.Which way is more accurate?

    One should not be "more accurate" than the other if the same clock is used to profile. If in both cases the clock is enabled after the first breakpoint is reached and the clock value is 0, then the target is run to the next breakpoint, the cycle count should be the same

    f I call run() API in the script to make the target run first, it is sad that target does not return control, so i can't pause it ,add breakpoint and run it again. it seems that i only  can call add.breakpoint() API firstly then call run() API , right?

    The is correct. the run() API is a blocking call and will only return when the target is somehow halted.

    Should i call halt() API if i want pause the target when it is running and call run() API again after pause it?

    Note that if the target is already running, but you are not blocked in anyway (for example you are using runAsynch), you can set a hardware breakpoint while the target is running. A hardware breakpoint does not need the target halted.

  • I can't quite tell the difference between the three API:

    debugSession.symbol.getAddress("ReadNextData")

    debugSession.memory.readRegister("PC")

    debugSession.expression.evaluate("PC")

    symbol.getAddress would get the address of a symbol (like a global variable, etc).

    memory.readRegister would return the value of a core or memory mapped register

    expression,evaluate - this one is a little complicated but it would try to return the value of an expression like a register or variable. I would not use this one if possible

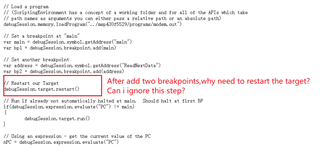
    target.restart would simply reset the PC to the program entry point. Whether you want to do that or not would depend on you. I would assume you would not.

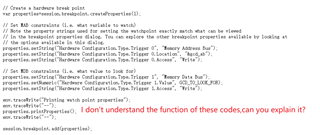
    properties.printProperties is to print out the available breakpoint properties. Please see the below link for more details:

    https://software-dl.ti.com/ccs/esd/documents/users_guide/sdto_dss_handbook.html#breakpoints

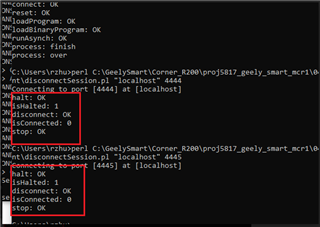
  • Hi Ki, sorry to bother you again, we used the script to call the runAsynch() API today, after the target board runs successfully, then call the halt() API to terminate the program, and finally disconnect the target, the information printed on the console is that the target has been successfully disconnected, and the server is also closed, but our software used to detect the signal sent by the target board shows that there are still signals being sent, these signals are sent by the ARM core, and the electricity on the ammeter shows 0.20~0.21A (when two cores are running, the electricity is 0.28~0.29A; when the ARM core is running, the electricity is 0.20~0.21A; when both cores are stopped and disconnected, the electricity is 0.17A), so we suspect disconnect() API did not successfully disconnect the two cores, which seems to be another API bug. The execution results are as follows:

  •        Recently, we have been using the APIs you provided to write scripts to link CANoe and Vteststudio (two softwares of vector company) to implement automated integration testing to run, pause, break points, read global variables and other operations. The whole work process is like this, we will first package your API into scripts, such as one script named addBreakpoint.pl is to call the add.breakpoint() API to achieve the function of adding breakpoints, and then Vteststudio will use C# language to encapsulate methods one by one, such as encapsulating an function named avoid addBreakpoint(string port), the implementation of the method is to open a black window process cmd, enter the execute script command in cmd, to run the corresponding script to add breakpoints, and then we will freely assemble these methods into cases in Vteststudio, such as a case containing connections, downloading programs, running targets, adding breakpoints, etc., and finally using CANoe to execute the cases assembled in Vteststudio  to achieve fully automated testing. It may sound dizzy, which is why we told you earlier that we wanted to split the API functions into separate scripts, so there is the TestServe method you provided. But we now have a problem that we can't solve by ourselves, which affects the implementation of our automated integration tests. It is more serious.The problem is the TestServe method, during the entire client and server session, the black window started by the server cannot be closed (unless both clients call the stop command, the server will shut down and return control, so that our code written in C# can end the server's process). This causes the background process of the server black window to be running all the time, CANoe finishes the server opening, will run until the last stuck, can not generate a case run result report, we can not call the stop command after the target class is running, because the server is closed, the client is disconnected, the target  stops, the signal on CANoe cannot be received, and we cannot make other judgments and operations through the received signals. The way we can currently think of is to take out the step of opening the server separately, start it manually, and then use CANoe to achieve the remaining steps: connections, downloads, runs and other operations in the case, these commands will return control  after execution, so the black window can be closed, CANoe successfully runs the case, you can see the signals sent by the target board, and then manually close the server black window until all the operations are completed, but this does not meet the automated test, it still requires manual participation. I have been debugging this test environment for the past two days, I want to ask you if there is any way to automatically turn on the server without letting CANoe freeze? We really need your help, thank you very much!

  • but our software used to detect the signal sent by the target board shows that there are still signals being sent, these signals are sent by the ARM core, and the electricity on the ammeter shows 0.20~0.21A (when two cores are running, the electricity is 0.28~0.29A; when the ARM core is running, the electricity is 0.20~0.21A; when both cores are stopped and disconnected, the electricity is 0.17A), so we suspect disconnect() API did not successfully disconnect the two cores, which seems to be another API bug.

    I suggest you try turing on IDE visibility like I mentioned in this post:

    https://e2e.ti.com/support/tools/code-composer-studio-group/ccs/f/code-composer-studio-forum/1135911/ccs-awr1843/4390905#4390905

    That way you can "see" the IDE while the script is running and see if the core is actually disconnected.

  • we have been using the APIs you provided to write scripts to link CANoe and Vteststudio

    I know very little of these tools so unfortunately I will not be able to provide much support for this integration effort. Sorry.

  • OK, I will consult you later if i meet other problems about CCS,thank you for your help during this time!

  •       Hi Ki, I review TestServe.js code of TestServe method,learn that if i  execute the "stop" command, the target will disconnect and session will  terminate, then the servw will shut down. That means i could run serve and connect target again if i want to continue to execute others commands. I tested according to my own understanding,I started the serve,connected target,loaded program,then ran the target,the target ran successfully.Then i executed the "stop" command,let the target disconnect and serve shut down.Wait for a while,I start the serev to open two session again,execute the "connect" command, feekback of execution tells me the target connect successfully, then i try to execute "halt" to halt program,but the result of execution is "fail" and "the target is already halt".I was puzzled by this result.I found the target actually halted by debugging.Why is target halt? I did not execute "halt" command. Is my own understanding wrong? Two days ago,I tested on CCS IDE,found that “connect” really can not stop the core sending message,only execute"halt" to halt the program and the core will stop sending message.

          Thanks for your reply.Best wish!

    Rui

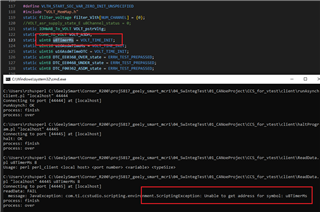
  • Hi,Ki,I try to call readData() API on script today, I want to read a static global variable named "u8TimerMs", but there is a error: 

  • t if i  execute the "stop" command, the target will disconnect and session will  terminate, then the servw will shut down.

    When I take a look at the stop command handler, it looks like:

    function stopCommandHandler(session, command) {
        /* This command is used to tell the session to stop taking connection from new clients.
           Any additional actions that needs to be done when a stop command is issued can be done here. */ 
        if (session.target.isConnected()) {
            try {
                session.target.disconnect();
            } catch (err) {
                return { "status": "FAIL", "message": "" + err};                  
            }
        }
        return { "status": "OK" };
    }

    Basically all this does it disconnect the target. It doesn't shut the debug session down. That surprised me because I thought it did shut the debug session down like you suspected. The debug session is actually shutdown by the shutdown function in TestServer.js

    ,I start the serev to open two session again,execute the "connect" command, feekback of execution tells me the target connect successfully, then i try to execute "halt" to halt program,but the result of execution is "fail" and "the target is already halt".I was puzzled by this result.I found the target actually halted by debugging.Why is target halt?

    The default behavior of the debugger is to halt the target on target connect. CPUs that support real-time mode can be configured to not halt on connect. For a AWR1843, the R4 does not support real-time mode with the C674x does.

    Thanks

    ki

  • I want to read a static global variable named "u8TimerMs", but there is a error: 

    All I can comment is that u8TimerMs must be in scope to get the address of the variable. You would expect global variables to always be in scope. Can you confirm the symbols are loaded?

    Again, to debug such issues I suggest enabling IDE visibility. It makes a big difference.

  •       Hey Ki, I know what you said about CCSIDE, we have tried to operate it according to the way in the link you gave, but we can't call up CCSIDE through Rhino Debugger, we are using CCS v11, according to the linked operation document it says" When CCS is opened by the Rhino Debugger, launch a Debug Session for the same exact target that is currently being used by DSS. It is important that the target specified in the *.ccxml file used by CCS is the same as the target specified by the *.ccxml file used by DSS." I understand that the *.ccxml file used in the script should be consistent with the *.ccxml file in our local CCS software configuration, and the downloaded program files should also be consistent, right?  then Rhino Debugger can call up the CCS software in our computer? But Rhino Debugger did not open our CCS, is it our operation is wrong? How can I open CCSIDE, if I open it, I think it should solve most of our doubts about APIs.Thanks a bounch!

  • I created a video of how to modify the testserver example to enable IDE visbility. Please see the attached script

    dss_testserver_ide.zip

    A few notes about the video:

    -note that rhino debugger will open at test_server.js. I step into the call on line 17 to open TestServer.js

    -In TestServer.js, I added a breakpoint on the call right after the call to open the IDE. It is important that the script waits here until the IDE is fully opened. I also set a breakpoint at line 202 bfore the connection is closed. This is so that after all commands are received from the client script, the testserver script will then halt - leaving the IDE open for further debug analysis.

    -After the first breakpoitn is reached, wait while the CCS IDE starts to open. Wait until it is fully openend and the press the "Go" button like in the video to have the scirpt continue. Open the rhino console and wait until the debug session has fully started and in the console the testserver is ready,

    -Run your client script and you will see the IDE update while the commands are executed. You can see in the rhino console the commands coming in. 

    -After the client script is done running, it will reach the second breakpoint and halt. This will allow you to play with the open IDE and investigate any issues

    My video runs the basic example that comes the test server. You would use your client script.

    Hope this helps

    ki

  • Another tip, you can set a breakpoint somewhere in the "while (line != null)" loop to halt the script for each command for more control. It is up to you.

  • Oh, thanks so much! I successfully opened CCSIDE with your help.Its function is simply too powerfui, i can clearly know the process of each step of my script.The global variable mentioned above was declared in the code by my development colleagues  and compiled , I tried to add a breakpoint in the .c file where the global variable is located, and it could not be added successfully, prompting me to cannot find the relevant code resources, which is very strange, I will ask the development colleagues tomorrow.

    I tried to call runBenchmark() API after add two breakpoint, then the target will run to the first breakpoint, then i call runBenchmark() again, i found the target start to run and then still stop at the first breakpoint. After i call runBenchmark() API for the third time,the target run to the second breakpoint and return a clock value.If i don't check the process of my script by CCSIDE,i will think that the value returned by the second call runBenchmark() API is the clock cycle count for code execution between the two breakpoint, but now it seems that it isn't, actually the third call returns the result is what i exactly need. So i feel that the result obtained by script calling APIs do not seem to be accurate.

  • Oh, thanks so much! I successfully opened CCSIDE with your help

    great! yes, this can be a really helpful tool to debug issues with the scripts.

    prompting me to cannot find the relevant code resources, which is very strange, I will ask the development colleagues tomorrow.

    CCS will look for source files using a relavtive path from the executable file. If the executable was moved from the original location, it may not be able to find the source and you will have to tell it where the source is.

    then i call runBenchmark() again, i found the target start to run and then still stop at the first breakpoint.

    So it just immediately halts at the same location that first time?

  • Yeah, when I called runBenchmark() for the second time, it just immediately halts at the same lacation that first time. I think it should be right at the second breakpoint.

  • Yeah, when I called runBenchmark() for the second time, it just immediately halts at the same lacation that first time. I think it should be right at the second breakpoint.

    That is odd. I have no explanation for this. As a test set up your script so that it only runs to the first breakpoint and then see if you press "resume" in the IDE if it works better. Otherwise I don't really have any other suggestions.

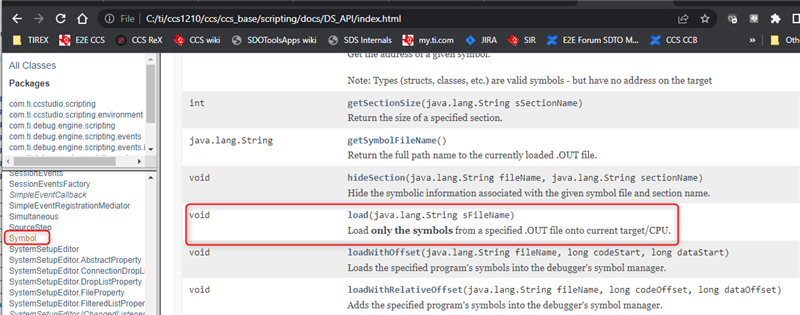
  • OK , I see. I find a function "load symbol" on CCS IDE,but it seems that I don't find this API on API document.Do you know which API is related with "load symbol"?Thanks

  • Sorry for the delayed response. I was on vacation for awhile and just returned.

    OK , I see. I find a function "load symbol" on CCS IDE,but it seems that I don't find this API on API document.Do you know which API is related with "load symbol"?

    It is symbol.load

    Thanks

    ki