Other Parts Discussed in Thread: AWR1843, AWR1642, AWR2944
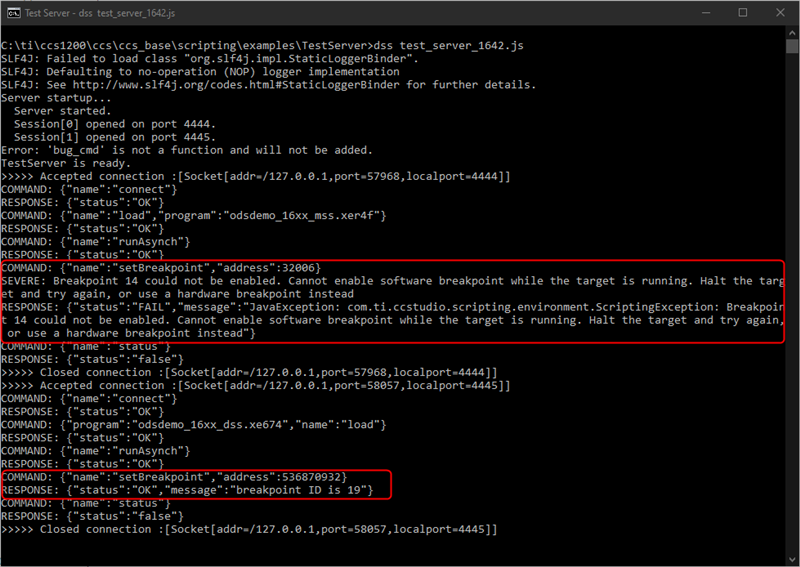
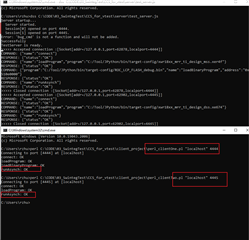
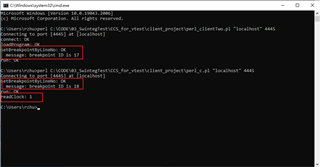
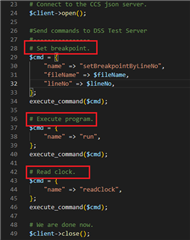
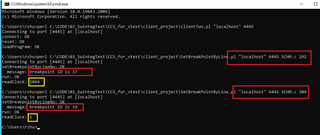
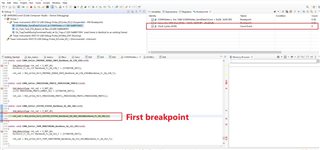
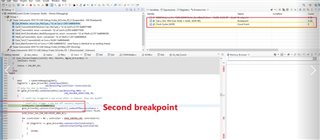
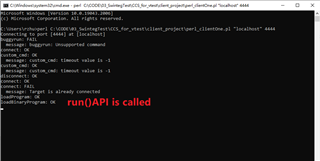
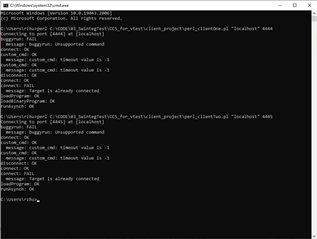
Hello KI, I am using AWR1843, XSD110 debugger and ccs software to build a debugging environment, and when I call the API to write a script to implement automated testing, I find that if I call the run() API, the target board can run successfully, the indicator light will flash, but the control will not be returned to the host application/script, and any operations following the run() command will not be executed, making the program unable to perform other operations. If the runAsynch() API is called, the control can be returned to the host application/script, and the operations after runAsynch() will be executed, but the AWR1843 target board will not be able to run successfully, the indicator light will not flash, if the timeout setting is added, it will display the target board fails to run, why is this? Is there any API that would allow the target board to run successfully, blink the lights and return control to the host application/script? The following are the execution results and script documentation, can you help? thank you very much!
BEGIN {
# Add the @INC path the directory where the DSSClient module is found.
push (@INC, "dss");
}
use strict;
use warnings;
use DSSClient;
if (scalar(@ARGV) != 2) {
die "Usage: perl perl_client <local host> <port number>\n";
}
my $host = $ARGV[0];
my $port = $ARGV[1];
#my $portTwo = $ARGV[2];
my $client = new DSSClient($host, $port);
my $cmd = undef;
my $result = undef;
# Connect to the CCS json server.
$client->open();
#Send commands to DSS Test Server
#----------------
# This command does not exist and should FAIL.
$cmd = {
"name" => "buggyrun",
};
execute_command($cmd);
# Connect to the target.
$cmd = {
"name" => "connect",
};
execute_command($cmd);
# Demonstrate the use of custom commands (report current timeout value)
$cmd = {
"name" => "custom_cmd",
};
execute_command($cmd);
# Demonstrate the use of custom commands (report current timeout value)
$cmd = {
"name" => "custom_cmd",
};
execute_command($cmd);
# Disconnect from the target.
$cmd = {
"name" => "disconnect",
};
execute_command($cmd);
# Connect to the target.
$cmd = {
"name" => "connect",
};
execute_command($cmd);
# Connect to the target.
$cmd = {
"name" => "connect",
};
execute_command($cmd);
# Load program.
$cmd = {
"name" => "loadProgram",
"program" => "C:/Tool/JPython/bin/target-config/xwr18xx_mrr_ti_design_mss.xer4f",
};
execute_command($cmd);
# Load program.
# $cmd = {
# "name" => "load",
# "program" => "C:/Tool/JPython/bin/target-config/xwr18xx_mrr_ti_design_dss.xe674",
# };
# execute_command($cmd);
# Load program.
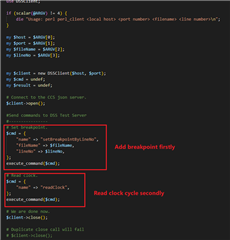
$cmd = {
"name" => "loadBinaryProgram",
"program" => "C:/Tool/JPython/bin/target-config/ROC_LCP_FLASH_debug.bin",
"address" => "0x510e0000",
};
execute_command($cmd);
# Execute program.
$cmd = {
"name" => "runAsynch",
};
execute_command($cmd);
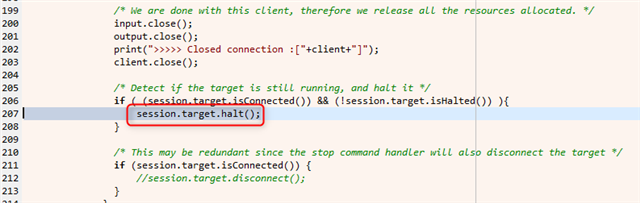
# We are done now.
$client->close();
#------------------
# execute command
sub execute_command
{
$result = $client->execute($_[0]);
if (defined $result) {
print "$_[0]{name}: ". $result->{"status"} . "\n";
# If there is a message, print it
if (exists $result->{"message"} ) {
print " message: " . $result->{"message"} . "\n";
}
# If a value was returned, print it
if (exists $result->{"value"} ) {
print " value: " . $result->{"value"} . "\n";
}
} else {
print "$_[0]{name} execution failed\n";
}
}