This thread has been locked.

If you have a related question, please click the "Ask a related question" button in the top right corner. The newly created question will be automatically linked to this question.

HW Breakpoints On A NOP Don't seem To Work As Expected

Hello,

I'm using CCS 12 with F28379D and XDS110 probe.

On other processors I have made frequent use of NOP + HW breakpoint to temporarily check that I am reaching certain branches of the program especially in highly optimization or inlined code.

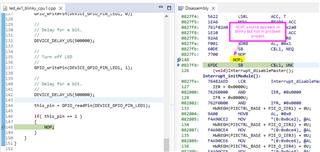
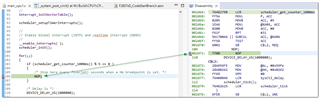
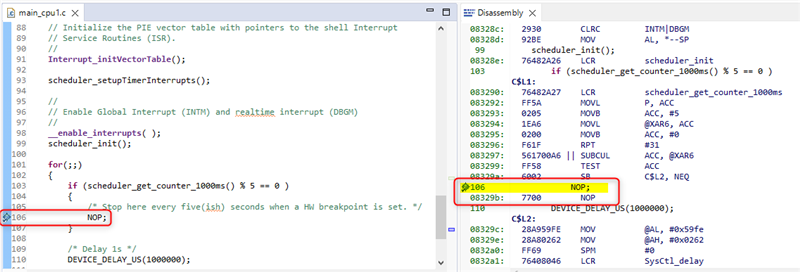
My problem is that in CCS, I cannot set a HW BP at a NOP even though the assembler reflects my source.

Furthermore setting a HW breakpoint at the NOP in the Dissassembly window stops the program at the wrong place. Please see the picture below.

Can you please help to understand what's going wrong here? The assembler looks right but a BP at the NOP instruction at 0x8CF25 does not stop the program there.

Thank you very much.

  • Hi Kier,

    Would it be possible to provide a small reprodicuble test case that I can run on my F28379D LaunchPad? I would need the prohect with source so that I can build it.

    Thanks

    ki

  • Hi Ki,

    Thank you. I tried to reproduce it in a blinky project but could not.

    I did notice however that my blinky project shows the NOP; source statement in the disassembly view but the problem example above does not. I'm not sure if that sheds any light on the matter?

    Anyway I guess I'm stuck with this until I can find enough time to reproduce it.

  • I did notice however that my blinky project shows the NOP; source statement in the disassembly view but the problem example above does not. I'm not sure if that sheds any light on the matter?

    What is the optimization level for the problem project? It looks like there is no source code correlation for that NOP in the problem project.

    Thanks

    ki

  • What is the optimization level

    It's 3.

    It looks like there is no source code correlation for that NOP in the problem project.

    My point exactly and therein lies the problem. The source and assembly match from a program flow point of view (compare == 4, branch if not, continue to NOP otherwise) so why doesn't the disassembler make the correlation like it does in the simple project?

  • It's 3.

    That is pretty high. I;m guessing that the sample project doesn't have that level of optimization.

    What happens when you turn off optimization?

  • Case a) Optimization Level 0: OK, I can set the HW BW at instruction instruction NOP (0x8AB7A) and source level BP in the correct place, line 87:

    Case b) Optimization Level 1: NG, I cannot set it. Setting the HW BP at instruction NOP (0x8AADF) sets the source level BP in the wrong place, line 82.

    However note that the assembler in Case (a) and Case (b) is identical. Therefore optimization is not affecting my program in this case, it only affects my ability to place a HW BP. From the microcontroller's point of view, I think there is zero difference between the two cases. It should be able to place the HW BP at the NOP in both cases.

    I can only conclude therefore that there's some problem with the GUI or the debug symbols in the .out file when optimization is increased to 1 or above.

  • Please provide a small test case (project + source + out file). that I can rebuild myself. Please make the test case as small as possible but that can reprdouce the issue. 

  • Thanks Ki. PFA the remnants of my actual project after I've stripped everything out.

    As it is, the NOP in the disassembly will not correlate with the NOP in the source with L1 optimization:

    If you change the optimization of file main_cpu1.c to L0, the NOP in the disassembly does correlate with the NOP in the source:

    The assembly and source is identical in both optimization conditions and therefore I expect the source code correlation to be identical. I would understand if optimization had removed the NOP but that is not the case here.

    6683.CPU1.zip

    This project is for controlCARD. Please add _LAUNCHXL_F28379D to predefined symbols.

  • Thanks Kier,

    I can reproduce the issue also. 

    Note that in the L0 case, you can see the source line for the NOP (line 106) interleaved in the disassembly (see the yellow highlight)

    That interleaved source line is missing in the L3 case. Speaking to a debugger engineer, it looks like the debug symbols for L3 is missing that information to allow the debugger to do the source code correlation (otherwise you'd see that source line in the disassembly window). I suspect that turning on L2+ (function level optimization or greater) would have the compiler to perhaps ignore emitting some lines not related to function information, regardless of if the assembly instructions were reordered/changed from the non-optimized case. 

  • Thanks for confirming. Yes, the debug symbols do appear to be the problem. Note however, the problem is triggered at L1. L0 is fine, L1+ is broken.

  • I know L2 is function level and L1 is local level. Not quite sure what "local" refers to but I guess it also impacts this.

    Note that this debug behavior is behaving "as expected". We do not guarantee proper source level debug visibility as optimization is increased. So while things can possible be improved, it is not really "broken"

  • We do not guarantee proper source level debug visibility as optimization is increased

    An article on this:

    https://dev.ti.com/tirex/explore/node?node=A__AEm7LJjS34iFPa5fpT7ttQ__ccs_devtools__FUz-xrs__LATEST

  • Thanks but I'm familiar with this trade off. The debug capability should be expected to diminish as the assembler diverges from the source but that is not the case here. If the assembler is unchanged after optimization but the toolchain no longer allows breakpoint setting, for whatever reason, that is arguably a deficiency in the toolchain. I guess we'll have to agree to disagree.

    A shame this wasn't waved away before I spent an hour or so making the reproducable example.

  • for whatever reason, that is arguably a deficiency in the toolchain. I guess we'll have to agree to disagree.

    I don't necessarily disagree. It is a limitation (or deficiency) of sorts. It can be certainly room for improvement. It is also worth checking out (on our end) how other toolchains (like GCC) handle this.

    A shame this wasn't waved away before I spent an hour or so making the reproducable example.

    Your reproducible example is very much appreciated. I hope to use it to look at further enhancements for our tool. I hope you don't feel it was a waste.

    ki

  • Thank you and apologies, I'm in a better mood today.