This thread has been locked.

If you have a related question, please click the "Ask a related question" button in the top right corner. The newly created question will be automatically linked to this question.

Stepping through assembler files in Editor window does not work ("No source available for...")

Hi,

I'm using CCS 12.1.0 for development of an ARM SoC (AM64x) boot code in Assembler and C, so I have a mix of *.S and *.c files. All my C and Assembler files are compiled/assembled with "-g" and "-gdwarf-3".

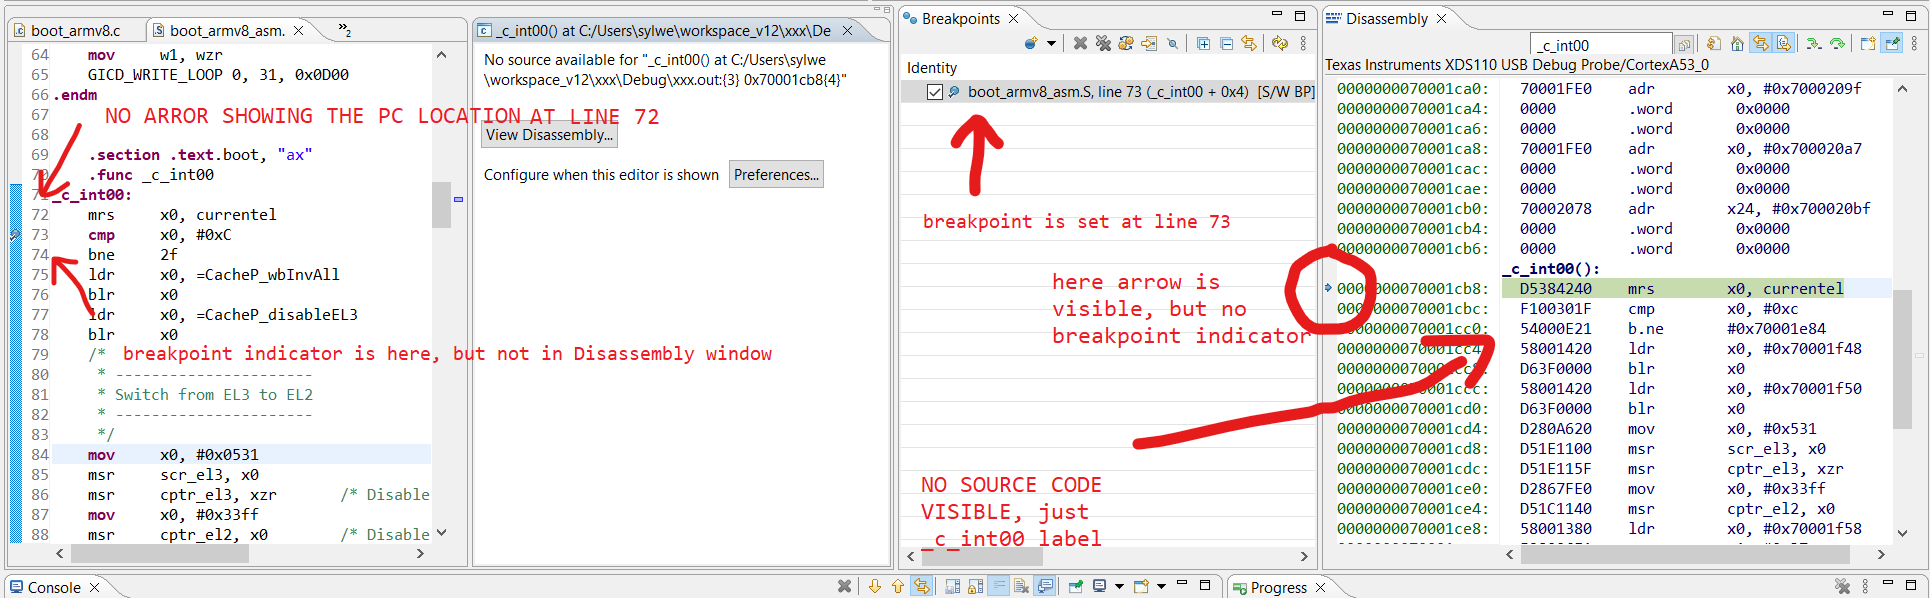
I can normally step the C code in both Editor window and in Disassembly window (there are "arrows" showing current instruction/line). In Disassembly window I see instructions mixed with C code (I enabled "Show source") and this is great.

The problem is with Assembler files (*.S). I can see in MAP file, that all the debug sections are generated for *.S files (including .debug_lines). However, in Disassembly window there are only labels and raw instructions without any comments and whitespacing from my original assembler sources. The Editor window claims that: "No source available for <<here_some_symbol_from_my_S_files>>" and there is a button "Show disassembly". But I'm 100% sure that all the debug info for my Assembler sources is available in the ELF file, because when I open any Assembler file in Editor window, I can:

- set a breakpoint (and execution will stop at it)

- use "Run to line", "Move to line" and "Resume at line"

but there is no "arrow" which shows current line of execution in any of my Assembler files (something which works for C code just fine).

I know that stepping through original Assembler sources is a feature that all the debuggers/IDEs (I've been using so far), have, including GDB. However, for some reason CCS does not allow that. Now the question is: Is it a bug? Is there a hidden option to enable? Is it a limitation of the underlying Eclipse?

Screenshot below.

I will be grateful for any input on this subject.

Thanks,

Sylwester

  • Hello Sylwester,

    I know that stepping through original Assembler sources is a feature that all the debuggers/IDEs (I've been using so far), have, including GDB. However, for some reason CCS does not allow that. Now the question is: Is it a bug? Is there a hidden option to enable? Is it a limitation of the underlying Eclipse?

    CCS does support this. But there are some instances where this may not work. Can you provide a small test case? I would need the project + source + executable. I don't need you actual full project, you can strip it down to just a file if you can. As long as the issue can be reproduced and i can recompile the project.

    Thanks

    ki 

  • Hello Ki,

    Thank you for replying!

    That was my guess, that this is just some issue in CCS. It would make no sense to not to include such an important functionality.

    You can find the full project with the executable under below link. To be able to recompile it you need to install mcu_plus_sdk_am64x_08_04_00_17.

    https://www.dropbox.com/s/8aiwymut7gawqc9/project.7z?dl=0

    And one more thing (screenshot). If I click first on Editor window to add a breakpoint and then in Disassembly window at the same address, then two breakpoints are created, but they actually are set at the same instruction (see the breakpoint list).

    Thanks,

    Sylwester

  • www.dropbox.com/.../project.7z

    Unfortunately, IT blocks access to common file share sites like dropbox and google drive. I did get a tempporary exemption for dropbox but I am having issues downloading the zip. Can you attach the zip to this thread directly? 

  • Unfortunately, IT blocks access to common file share sites like dropbox and google drive. I did get a tempporary exemption for dropbox but I am having issues downloading the zip. Can you attach the zip to this thread directly? 

    Nevermind, I was able to download the zip. Thanks

  • I see the same issue.

    This message "No source available for "_c_int00() at C:/ti\workspaces\1210\xxx\Debug\xxx.out:{3} 0x70001cb8{4}" indicates that there is no source code correlation in the debug symbols. A bit confusing since you can set a source line breakpoint in boot_armv8_asm.S and the target will indeed halt there.

    I get the issue with the assembly file. main.c looks fine

    I tried rebuilding with -Og (best debug experience) but it did not help. I'm not sure what the issue is. I'll need to follow up with engineering and keep you posted.

    Thanks

    ki

  • I'll need to follow up with engineering and keep you posted.

    Note that due to various local holidays it may take some time to get an update for engineering.

  • Thank you for y our patience. Engineering has investigated the issue and it appears to be a bug with the symbol manager. See the below tracking link for the bug and note the workaround listed there:

    https://sir.ext.ti.com/jira/browse/EXT_EP-11010

    Thanks

    ki

  • Hello Ki,

    I checked the workaround and it works for the project that I shared with you, however for another project that I have the workaround causes assembler files symbols to be removed even from "Diassembly" window. I guess it will be better to wait for the fix release.

    Thanks,

    Sylwester

  • The workaround is simply using the legacy symbol loader instead of the default new one. The issue with the legacy loader is that it can't handle some of the new information generated by current versions of the Arm clang compiler. Hence using the workaround may help with one issue only to create others unfortunately.