This thread has been locked.

If you have a related question, please click the "Ask a related question" button in the top right corner. The newly created question will be automatically linked to this question.

MSP Debug Call stack error

Part Number:

Tool/software: Code Composer Studio

Hello,

I am developing a project based on MSP430FR4133.

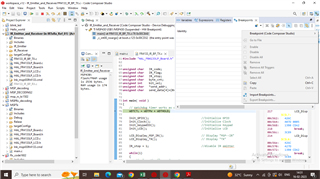
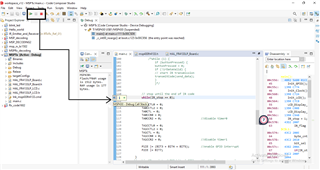
There are moments that my debugging tool stops in a "phantom" breakpoint inside the program.  

It is called "MSP Debug Call stack".

Could you explain me, what is happening at this point and how can i solve this issue?

I am attaching a photo with my issue.

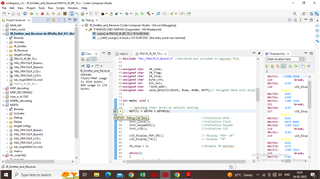
tried to solve with this breakpoint disable but option is not enable

  • Hi Trupti,

    This looks to me like your debug session is halting at the first line of main, which is expected when you first launch to give you more control over when your code starts executing. 

    Is this occurring when you first launch the debug session or randomly after you've been running for a while?

    Best Regards,
    Brandon Fisher

  • PFA

    when I resume the code, that time halts the line.
    In this attached image I mentioned the issue. 
    This tool works like that or I am making a mistake.

  • Hi Trupti,

    That first one was normal. This does look like a breakpoint has been set here. Does it show up in your breakpoints window from before?

    If not, the first step I'd try would be a full reset or your PC and CCS, and then a full power on reset of your hardware and debugger.

    Best Regards,

    Brandon Fisher

  •  Hi Brandon Fisher

    Yes, I done this things- full reset or your PC and CCS, and then a full power on reset of your hardware and debugger.

  • HI Trupti,

    Can you please open the scripting console in CCS (go to View -> Scripting Console) and enter: eval("DEBUG_DumpBreakpoints()") while you are running a debug session, and then post the output here. 

    After that I want you to enter the command bra() into the scripting console. That should remove all breakpoints.

    Best Regards,
    Brandon Fisher

  • HI,

    still same issue not solved.

    Scripting Console output is like that, 

    MSP430: Flash/FRAM usage is 1508 bytes. RAM usage is 173 bytes.
    MSP430: Breakpoint Manager Dump: Total Allocated Logical Breakpoints: 4

    MSP430: Breakpoint Manager Dump: Total Allocated Software Physical Breakpoints: 5

    MSP430: Breakpoint Manager Dump: Total Allocated Legacy Hardware Physical Breakpoints: 0

    MSP430: Breakpoint Manager Dump: Total Allocated 55 Hardware Physical Breakpoints: 0

    MSP430: Breakpoint Manager Dump: Total Allocated Thread Physical Breakpoints: 0

    MSP430: Breakpoint Manager Dump:

    MSP430: Breakpoint Manager Dump: Enabled: 0

    MSP430: Breakpoint Manager Dump:

    MSP430: Breakpoint Manager Dump: Disabled: 4

    MSP430: Breakpoint Manager Dump:

    MSP430: Breakpoint Manager Dump: Hardware Configuration

    MSP430: Breakpoint Manager Dump: Location: "C$$IO$$"

    MSP430: Breakpoint Manager Dump: Debugger Response

    MSP430: Breakpoint Manager Dump: Condition:

    MSP430: Breakpoint Manager Dump: Skip Count: 0

    MSP430: Breakpoint Manager Dump: Current Count: 0

    MSP430: Breakpoint Manager Dump: Action: Process CIO

    MSP430: Breakpoint Manager Dump: Miscellaneous

    MSP430: Breakpoint Manager Dump: Group: Default Group

    MSP430: Breakpoint Manager Dump: Name:

    MSP430: Breakpoint Manager Dump: Breakpoint set by the system

    MSP430: Breakpoint Manager Dump:

    MSP430: Breakpoint Manager Dump: Hardware Configuration

    MSP430: Breakpoint Manager Dump: Location: "C$$IOE$$"

    MSP430: Breakpoint Manager Dump: Debugger Response

    MSP430: Breakpoint Manager Dump: Condition:

    MSP430: Breakpoint Manager Dump: Skip Count: 0

    MSP430: Breakpoint Manager Dump: Current Count: 0

    MSP430: Breakpoint Manager Dump: Action: Process CIO

    MSP430: Breakpoint Manager Dump: Miscellaneous

    MSP430: Breakpoint Manager Dump: Group: Default Group

    MSP430: Breakpoint Manager Dump: Name:

    MSP430: Breakpoint Manager Dump: Breakpoint set by the system

    MSP430: Breakpoint Manager Dump:

    MSP430: Breakpoint Manager Dump: Hardware Configuration

    MSP430: Breakpoint Manager Dump: Location: "C$$EXITE"

    MSP430: Breakpoint Manager Dump: Debugger Response

    MSP430: Breakpoint Manager Dump: Condition:

    MSP430: Breakpoint Manager Dump: Skip Count: 0

    MSP430: Breakpoint Manager Dump: Current Count: 0

    MSP430: Breakpoint Manager Dump: Action: Terminate Program Execution

    MSP430: Breakpoint Manager Dump: Miscellaneous

    MSP430: Breakpoint Manager Dump: Group: Default Group

    MSP430: Breakpoint Manager Dump: Name:

    MSP430: Breakpoint Manager Dump: Breakpoint set by the system

    MSP430: Breakpoint Manager Dump:

    MSP430: Breakpoint Manager Dump: Hardware Configuration

    MSP430: Breakpoint Manager Dump: Location: "C$$EXIT" (0xc9b2)

    MSP430: Breakpoint Manager Dump: Debugger Response

    MSP430: Breakpoint Manager Dump: Condition:

    MSP430: Breakpoint Manager Dump: Skip Count: 0

    MSP430: Breakpoint Manager Dump: Current Count: 0

    MSP430: Breakpoint Manager Dump: Action: Terminate Program Execution

    MSP430: Breakpoint Manager Dump: Miscellaneous

    MSP430: Breakpoint Manager Dump: Group: Default Group

    MSP430: Breakpoint Manager Dump: Name:

    MSP430: Breakpoint Manager Dump: Breakpoint set by the system

  • Hi Trupti,

    No breakpoint is being listed in your project for this location. I am rereading your old posts here, just to clarify, are you stopping the execution by pressing the pause button, or is CCS stopping it on its own?

    The code looping here until IR_stop is set  is normal, but if its pausing on its own that is not. If it is pausing, then at this point I would try to copy your project into a new CCS workspace. If it persists past that, I would try a new launchpad just to ensure something isn't wrong with onboard debugger. 

    Best Regards,
    Brandon Fisher