Other Parts Discussed in Thread: AM2634
Hello,
The SoC is AM2634 and assume dual core mode.
All cores have "Core-specific Internal Memory Map" starting 0x0000 0000 extending to at least 32 KB depending on the core. Therefore the contents of address 0x0000 00020, for example, could be completely different between all cores. Each core specific memory starting 0x0000 0000 is mapped to an address accessible by the other cores as follows:
R5_0 | 0x7800 0000
R5_1 | 0x7820 0000
R5_2 | 0x7840 0000
R5_3 | 0x7860 0000
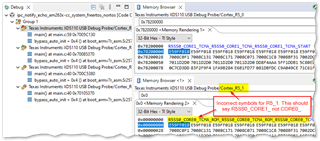
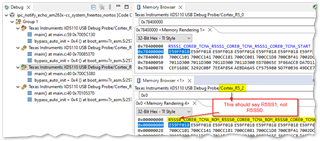
Using the Memory Browser at address (0x0000 0020) does indeed show different memory contents depending on the debug core context. However, the symbol overlays (blue text) are incorrect for cores other than core 0. In the R5_1 view, it's using symbols from the R5_0 context.
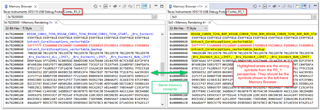
What is required however is the debugger to show the blue symbols from the left hand memory browser (0x7820000) in the right hand memory browser (0x00000000) based on the fact that the TCM memory (0x78200 0000) for R5_1 is mapped to 0x0000 0000.