Hi all,
when i try tools--> profile in ccs4 after i launch the debug , a new window comes up on the screen "the chosen operation is not currently available"
any help ?
thanks....
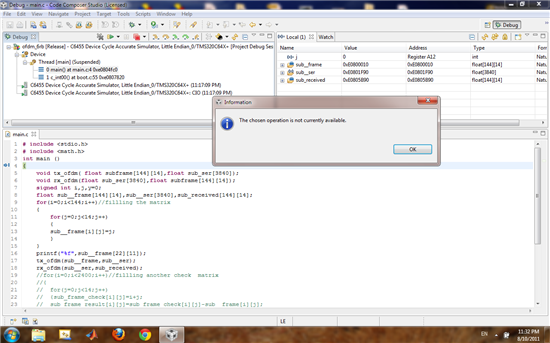
Hi all,
when i try tools--> profile in ccs4 after i launch the debug , a new window comes up on the screen "the chosen operation is not currently available"
any help ?
thanks....