This thread has been locked.

If you have a related question, please click the "Ask a related question" button in the top right corner. The newly created question will be automatically linked to this question.

UIA Log Messages -- Unable to Display Strings

Expert 2430 points

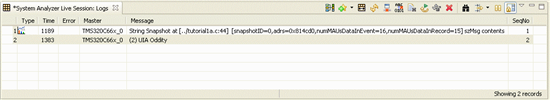
Unless I use a constant string literal, the Log_printx() will only display "<String @[its address]>" instead of the actual string even though a string is a supported format specifier (%s).  Is this a bug, or am I just doing something wrong?  (See screen shot below.)


Oh, and in case it is suggested, in my original code, my char buffer was a global variable, not a stack variable, but I still got the same "<String @blah blah>" results.  Also, it's not an implicit casting issue.  My original code is casting it as "(IArg)((const char*) &szMsg[0])" but for screen shot purposes and width restrictions, I removed the cast since I get the same results anyway.

  • Hi Alex,

         In order to display the text associated with a dynamically allocated string, System Analyzer needs to have the string's memory content uploaded in a separate 'snapshot' event.   Here's how to do this:

    1.  in your .cfg file, add the following line so that your program can use the ti.uia.runtime.LogSnapshot module:

    var LogSnapshot = xdc.useModule('ti.uia.runtime.LogSnapshot');

    2.  at the top of your .c file, add

    #include <ti/uia/runtime/LogSnapshot.h> 

    #include <string.h>   // for the strlen API

    3.  add the following line of code after the string has been initialized but before it has been logged with the Log_print1 API:

    LogSnapshot_writeString(0,"szMsg contents",szMsg, strlen(szMsg));

    Here's the resulting System Analyzer output in the Log View:


    My apologies for the poor documentation on this topic.  I'll update the CDoc documentation for the LogSnapshot module in UIA to better describe how to use the API, and will also post a tutorial on the System Analyzer Wiki showing how to use the API.

    I hope this helps.  Thanks for your interest and feedback!

    Regards,

      Brian


  • Thanks for the detailed instructions.  I'll give it a shot, but given your above demonstration, I'm sure it will work.

    Question, though.  Is there any way to show only the message and not the two screens full of distracting file, line, snapshot, and MAU data trace info? :-)

    P.S. No need to apologize.  I still feel like a kid on Christmas morning while learning to use your new MSA tools (including the UIA).  Word of warning:  My current project is a multiprocessor design, all C6474 DSPs, so as you can imagine, thorough system analysis and load balancing are a necessity for me, not an optional frill.  I apologize in advance if I start spamming the forum with questions about MSA's use in the feat over the next few months. ;-)

  • Hi Alex,

         You can configure what columns are displayed in the LogView by right-clicking on the table in the view, selecting  "Column Settings"

    You can then clear any checkboxes for columns that you are not interested in.  e.g.

     The file / line / snapshot ID info is currently logged as part of the "Message" string defined for the UIASnapshot event, however, so this information will still be displayed.    

    To make the message strings easier to read, we're considering adding an enhancement to parse the message string so that the file and line number info displayed in a separate column.   You would then be able to hide this information by unchecking that column in the Column Settings.   We're also looking into what the implications of having a separate column to display any text that is located at the start of the remaining message string that is within [square brackets].    Do you think that these types of changes would be the right approach?

    Re: Word of warning:  My current project is a multiprocessor design, all C6474 DSPs, so as you can imagine, thorough system analysis and load balancing are a necessity for me, not an optional frill.  I apologize in advance if I start spamming the forum with questions about MSA's use in the feat over the next few months. ;-)

    No need to apologize! :-) Your feedback and questions are very much appreciated, as they help us to understand what we need to do to make System Analyzer and UIA easier to use and what features are important.  Looking forward to helping you with any UIA or System Analyzer questions you may have.

    Regards,

        Brian


  • So I finally got around to trying what you suggested (I assumed it would work, hence was in no hurry to test it out), and I am still getting a "String @<address>" rather than the actual string.

    I even wrote a dummy function to mimic exactly the sample funtion you have in the help file (in the LogSnapshot_writeString() section).

    Passing a string to that function just yields the following output (I'm just citing the "Message" column here):

    "String Snapshot at [../UIA_Test.cpp:131]  [snapshotID=0,adrs=0x1081ab40,numMAUsDataInEvent=68,numMAUsDataInRecord=67] User-defined name=<String @72616f42>."

    If I step through the code up to the LogSnapshot_writeString() call, the string I am using is valid--it's just does not seem to get sent to CCS.

    Long story short, be it via Log_printx() or LogSnapshot_writeString(), the string pointer used for "%s" has to be stored in the .const section, i.e., a string literal, or it won't get copied and sent.

  • Hi Alex,

     In the current release, you need to follow the call to LogSnapshot_writeString()  with a call to Log_printX in order to have the string decoded.  Here's the full example code:

            char szMsg[256];
            sprintf(szMsg,"%s","(2) UIA Oddity\n");
            LogSnapshot_writeString(0,"szMsg contents",szMsg, strlen(szMsg));
            Log_print1(Diags_USER1,"%s",(IArg)szMsg);

    Once the string contents have been uploaded by the call to LogSnapshot_writeString, the host-side tooling is able to resolve the address that is referenced by the %s format specifier in an event,.  i.e. any call to e.g. Log_print1(Diags_USER1,"%s",(IArg)szMsg); that occurs after the LogSnapshot_writeString() event has been logged will be displayed with the dynamically allocated string contents shown as text instead of as the address of the string.  

    I can see that, from a user's perspective, it would make a lot more sense to simply be able to upload the string and display it using the same event.   We'll try to make some changes in the way the host-side tooling decodes events to enable that in one of the upcoming System Analyzer releases. 

    Thanks for your help with this!

    Regards,

       Brian


  • Ah, okay.  That makes perfect sense now that you explained it.  Actually, that will work out well since I can hide the snapshot messages (in the viewer) and just display the printf events and not care about all that additional trace info being pre-pended to my message.  Anyway, I'll test this out in a bit and come back and "Verify" your reply if it works out (or post another reply if it doesn't).

    This might be hard to quantify, but exactly how costly (in terms of DSP execution flow interruptions) are LogSnapshot events compared to Log_print events?

  • Hi Alex,

        It is hard to quantify, as it depends on compiler options, cache utilization, memory placement, etc. 

    In general terms, what the LogSnapshot_writeString macro does is it calls the LoggerCircBuf_writeMemoryRange API, which logs the event with a special header identifying it as a memory snapshot, calculates how many events it will take to upload the string contents (taking into account the LoggerCircBuf_maxEventSize configuration option, which defaults to 128 bytes), and then writes the calculated number of events in a loop, using memcpy to copy the event header and the relevant portion of the string memory into the logger's circular buffer.   With the default 128 byte max event size, strings that are longer than 88 bytes in length  will be logged using multiple events.   Interrupts are disabled around the writing of each of the events and are then released, so the worst-case latency is bounded by how long it takes to write a single event. 

    The most reliable way to determine how much time a given API call takes is to measure it.  Tutorial 1b shows how to use System Analyzer to do benchmarking.  I've attached a .c file that contains a function called benchmarkSnapshot() that can be called to test out how long the LogSnapshot_writeString API takes to execute.   1727.benchmarkSnapshot.zip.  

    If you start with the UIA Tutorial1 project, you can replace, in main.c, the call to tutorial_1A() with a call to benchmarkSnapshot().   After rebuilding the project, you can then launch a simulator, load the project, run System Analyzer / Live and then run the Tutorial1A_LoggingEvents gel script function to call the benchmarkSnapshot() function.  It will log a series of events - the first events are only there to get the UIA code into cache.  The subsequent ones are used to benchmark how long it takes to call Log_write3 and LogSnapshot_writeString.   Here's what you get when you run the Duration analysis on the events:

    The amount of time it takes to do the LogSnapshot is calculated by subtracting the amount of time it takes to log the benchmark event (140 ns in this example), so it takes 551 - 140 ns = 411 ns to upload the szMsg string and the snapshot event that describes it. 

    I hope this helps.

    Regards,

      Brian 

     <edited to get rid of trailing white space>

  • Thanks for that.  For future readers of this thread, don't forget to add the necessary "var LogSnapshot = xdc.useModule( 'ti.uia.runtime.LogSnapshot' );" line to your SYS/BIOS configuration file, else you will get several linker errors ("unresolved externals"). :-)


    Interestingly, I could not get this to do anything using a simulator as my target.  Running on my target platform, though, I got the following:

    (Target is C6474 @ 1 GHz)

    Twice as long as your SIM results, but that does not surprise me.

  • Hi Alex,

        Re: Twice as long as your SIM results, but that does not surprise me.

    The duration results you're getting actually do surprise me - the Log_write3 time of 494 ns. especially looks quite high.   What target and platform are you building with?  When I build in Release mode with

    • Device Variant = Generic C64X+ Device
    • target =  ti.targets.elf.C64P,
    • platform = ti.platforms.evm6474,
    • build profile = whole_program

    ,  I get the following results on the C6474 EVM (with Mezzanine) at 1.044 GHz:

    Which are less than 1/2 of the CPU utilization you measured.   Lines 23-28 of the BenchmarkSnapshot.c file I posted enable L2 cache and set MAR128 = 1 to make 0x80000000 to 0x80FFFFFF cacheable - did your tests execute this code? 

    You can check what is in cache by using the Cache view (Windows / Show Views / Other... / Debug / Cache) and clicking on the + button in the toolbar to show details.  This will show you the symbols that are in cache.  You should see symbols named ti_uia_runtime_LoggerStopMode ... and ti_uia_runtime_LogSnapshot... in L1P, L1D and L2 cache: e.g.

    Also, I didn't have any problems running the code on Core 0 of the C6474 Symmetric Device Cycle Accurate Simulator (Little Endian).  I noticed that if, in the General Build Options, you leave the Device as C66X+ instead of changing it to C64X+, you will hit an invalid opcode error.  Perhaps this is what you were seeing? 

    Regards,

      Brian