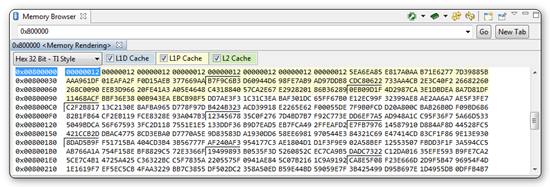
When doing a non-project debug session the "Enable Memory Analysis" button is greyed-out. How do I enable this so that I may see exactly what is in cache and external memory?
Lee
This thread has been locked.
If you have a related question, please click the "Ask a related question" button in the top right corner. The newly created question will be automatically linked to this question.
When doing a non-project debug session the "Enable Memory Analysis" button is greyed-out. How do I enable this so that I may see exactly what is in cache and external memory?
Lee
Lee,
This is for the C674x DSP core right? The feature is not available for the A8.
I tried this out in CCSv5.1 and it seems to be working fine on C6A8168. It came up enabled by default, I didn't have to change any settings.

I also tried CCSv4.2.4 and I see what you see, memory analysis is not available for me to enable it. I know there was an issue where the C674x core was not being recognized as supporting cache accesses but I had thought that was resolved. Looks like it is only resolved in 5.1.

Regards,
John
It won't find it automatically but if you copy it into the ccsv5\ccs_base\debugserver\license folder or point to it when the licensing dialog pops up it will take it. Once the GA release comes out in a couple months you will need a v5 license but v4 licenses work fine with the beta.
Note that if you select to use the 30 day eval license CCS will keep using that until it expires and then will ask for another license.
john
Ok, I managed to get CCS5.1 to recognize my license, but I cannot set breakpoints and "Enable Memory Analysis" remains greyed-out under the Memory Browser window, How do I set the source path lookup? The right click option no longer works. I did manage to get rov to work.
Lee
What error message do you see when you try to set breakpoints?
For memory analysis can you confirm that the C674x is selected in the debug view?
Did you try to use your workspace from CCSv4.x? I have seen that mess things up before. You can create a new workspace and import your existing projects into it (you can leave them where they are without copying if desired).
John
JohnS said:What error message do you see when you try to set breakpoints?
The breakpoint indicator flashes on then off.
JohnS said:For memory analysis can you confirm that the C674x is selected in the debug view?
Yes
JohnS said:Did you try to use your workspace from CCSv4.x?
I setup a new workspace.
Lee
Lee,
I tried out a couple more emulators with CCSv5.1 M7 and the 8168 board and I am still able to connect and show cache analysis fine.
Usually when there is a problem with setting a breakpoint there will be some sort of error message in the console view that provides more info. Note that you can't set a breakpoint if the core is running. If that is the case the breakpoint should show up but be disabled (no message is displayed in this case).
John