A related question is a question created from another question. When the related question is created, it will be automatically linked to the original question.
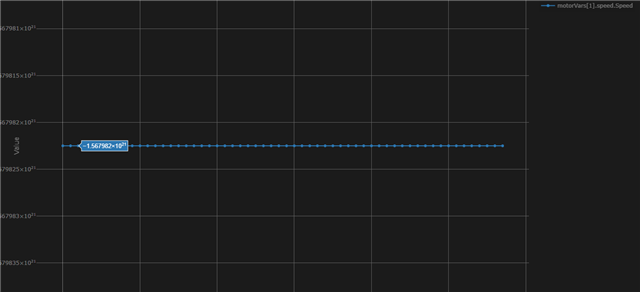
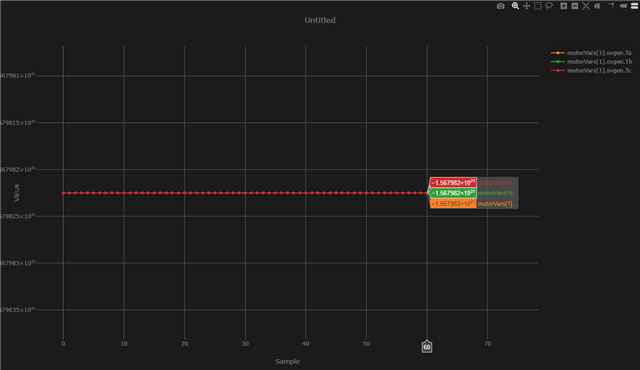
CODECOMPOSER: the version 20.3.0 is not plotting the graphs properly, sometimes it doesn't even plot anything, sometimes even if it plots it is showing some random number
Thank you for reaching out. I'm sorry to hear that you are experiencing this issue with graphs in CCS 20.3.
There were some changes made to graphs in CCS 20.3, one being that the graph expression inputs now represent memory locations. For example, if you have a variable 'x' and want to graph values of 'x', you need to provide the address of x in the input. In other words, you would have to add an ampersand in the beginning. Input would have to be '&x' instead of 'x' like before. If this does not solve your problem, please provide us with a screenshot of your graph properties, so we can provide further assistance. Thank you.
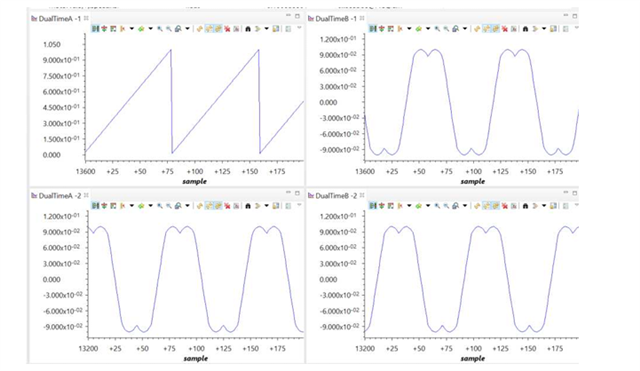
hii ki, that issue was resolved but I'm having issues in plotting a continuous plot like this (picture attached), when i put buffer accusation buffer size more than 1 no plot is getting plotted and even I'm changing sampling frequency it is working at 1 hz only, can you help to fix so i can be able to get a continuous plot .
Abhay - the screenshots and graph properties you mentioned are for the old graph in CCS 12.x. Have you reverted back to using this older version due to limitations with the new graph in CCS 20.x?
No- this plot is Screenshot of a user guide which used CCS 12, I'm using CCS 20.3 only but I'm not able get continuous graph like it , as it sampling frequency only working at 1 Hz so graph is not continuous and you can't make any sense out of it, so I wanted to know what properties graph we need to set in order to get continuous plot
Hi Abhay - I split your last question regarding the Motor Control SDK off the original thread and moved it to a separate thread in the C2000 forum. The experts will be able to assist further there.