This thread has been locked.

If you have a related question, please click the "Ask a related question" button in the top right corner. The newly created question will be automatically linked to this question.

Measurement marker difference on Sys/BIOS execution graph?


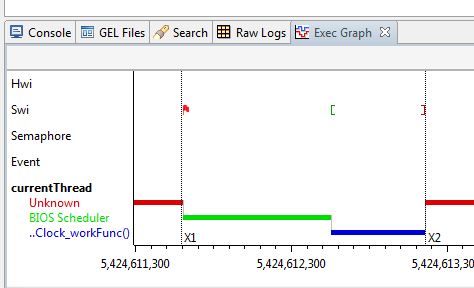
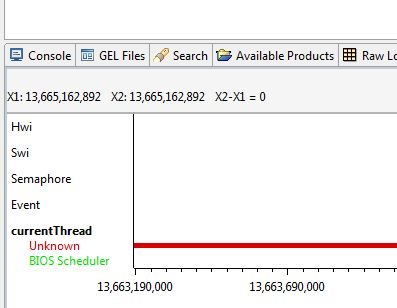
I'm using CCS V5.1.1.00031 and Sys/BIOS.  All is generally working fine.  On the Execution Graph, however, I can place measurement markers (X1, X2 etc.), but I thought that there was a way to show the difference between X2 and X1 (i.e. the Execution Graph view would show the timestamps for X1, X2 and X2-X1 in the upper-left corner).  But I'm not seeing anything.  Am I just mistaken on this capability or do I have to configure something else first?

Thanks,

Darrin


  • Darrin,

    The values and delta should show in the grey bar at the top of the graph. Can you try increasing the size of the grey bar (drag the bottom line) and see if that helps. Did this work for before? Which Windows are you on?

    Regards,

    Imtaz.

  • Thanks Imtaz: that was it.  Even though it appears like the "default" size of the gray bar at the top "should" be sufficient to display a line of text, apparently it's not (at least it wasn't in the CCS installation on my Windows 7 PC, for whatever reason).  When I dragged down the bottom line (per your suggestion), the data appeared (see below).  I'm not sure if this line of text is some combination of OS, screen size, default font etc., but in my case the text seems to have a considerable amount of "dead" space above it (which pushes it down some and therefore doesn't make it visible unless you drag the gray bar down).

    Thanks again -

    Darrin

  • Darrin,

    I noticed this also ... we'll investigate the dead space.

    Regards,

    Imtaz.