Hi
I’m facing a strange problem using the Graph of CCS v5.
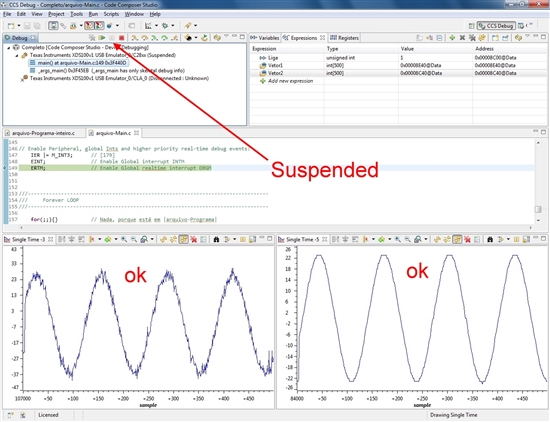
1- When the code is running, the graph shows a wrong waveform:
2- When I click suspend, the graph shows a correct waveform:
Obs: Is the same code, the only difference is the figure 1 is running the code, and figure 2 the code was suspended.
Some mistake is happening on plotting the real-time Graph.
There are any way to fix this problem?
Any idea?
Thanks!


