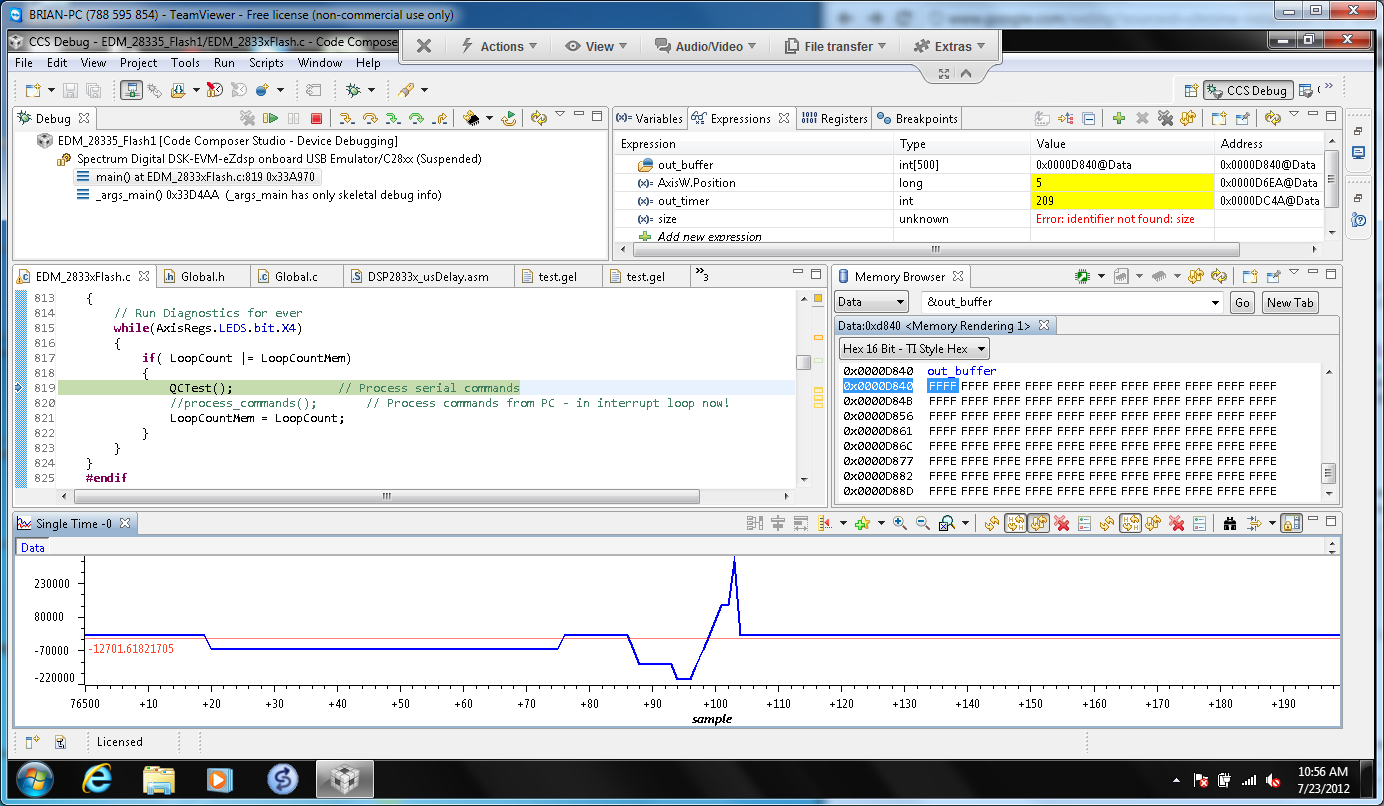
This thread has been locked.

If you have a related question, please click the "Ask a related question" button in the top right corner. The newly created question will be automatically linked to this question.

Trying to graph an output, not understanding it....


Hi,

I'm trying to use the graph Single Time tool in CCS 5 and it's not working for me. I've attached a picture with my settings and the graph that I am getting.

 Here is the code that I'm using to set up the buffer, this is in a interrupt loop:

int *output = &out_buffer[0];   
output[out_timer] = AxisW.Position;   
if(out_timer == 500)    
out_timer = 0;

   out_timer++;


Picture with my settings:

  • Hi,

    I don't see anything particularly problematic with the graph parameters, therefore the first thing is to compare the actual memory contents with the graph display: open a memory browser view and point to the buffer, so you can compare the values in memory. If the values match, you then have a problem in your algorithm. If not, then try to put an ampersand (&) in front of the name of the variable (I recall that some versions required this, but I can't recall which ones).

    Also, keep in mind that using signed values on the graph may cause it to jump around, especially if you have alternating negative values (larger than 0x80000000) and postitive values (up to 0x7FFFFFFF).

    The code is very incomplete, therefore I can only make some comments:

    - check if the indexer variable out_timer is properly incrementing at every iteration (not sure if this is the loop iterator or something else). If not, it will only update the initial position of the array or will update random places.

    - check if the initialization value AxisW.Position has expected values at every iteration (or every call to the ISR).

    Hope this helps,

    Rafael

  • I tried a few of your suggestions and I still can't get the thing to graph. 

    The iterator is working fine, I can see my values changing in the buffer both in the expressions window and the memory browser.

    When I add an ampersand in the graph property pages nothing shows up on the graph at all, even though I can see the correct values in the memory browser. 

    AxisW.Position is the position of a physical servo motor, so I can change it whenever I want. It has the expected values every time. 

    The one thing I did notice is that every iteration, in memory it only updated 4 hex values, one iteration will be like:

    0x0000D940 FFFF FFFF FFFF 1C32 FF9A D8B0 96B0 ...etc

    and the next iteration is:

    0x0000D940 FFFF FFFF FFFF FFFF FF9A D8B0 96B0

    This happens when AxisW.Position is a constant value of -1, hence the FFFF. Does this mean that it is a 16-bit value somehow? 

  • Heres a few screenshots of whats happening:

    My Properties screen again:

    The corresponding graph and memory window:

    As you can see, the graph is telling me that my values are ranging from -22000 to 23000, when in reality they are ranging from about -5 to 5.

  • So in the properties I changed it to a 16 bit value and it seems to be working fine now.

    Thanks,

    -Dru

  • Hi,

    Dru Steeby said:

    The one thing I did notice is that every iteration, in memory it only updated 4 hex values, one iteration will be like:

    0x0000D940 FFFF FFFF FFFF 1C32 FF9A D8B0 96B0 ...etc

    and the next iteration is:

    0x0000D940 FFFF FFFF FFFF FFFF FF9A D8B0 96B0

    This happens when AxisW.Position is a constant value of -1, hence the FFFF. Does this mean that it is a 16-bit value somehow? 

    Yes, you figured that out. The reason why the graph was showing a lot of garbage closer to the end is because it was set to display two times what you actually had as valid data in memory: the data was 16bits x length of buffer (2 bytes X 500 = 1000 8-bit bytes), but the settings were for 32bits x length of the buffer (4 bytes X 500 = 2000 8-bit bytes).

    Regards,

    Rafael

  • Great, thanks for your help. Now I'm running into an issue where the graph won't display at all, using the same properties that I had above with the exception of changing the 32 bit to 16 bit. Here's a screenshot of whats happening:


    You can see the values in memory of the out_buffer in the memory viewer, but they aren't being displayed on the graph. Another thing is that the properties dialog box is missing from the graph view, I can't seem to figure out how to keep that there. Sometimes it's there and sometimes it's not.