This thread has been locked.

If you have a related question, please click the "Ask a related question" button in the top right corner. The newly created question will be automatically linked to this question.

Does the profiling in CCS only work in Debug configuration?


Hi,

I once got an answer for profiling from this group:

http://e2e.ti.com/support/development_tools/code_composer_studio/f/81/p/201397/716554.aspx#716554

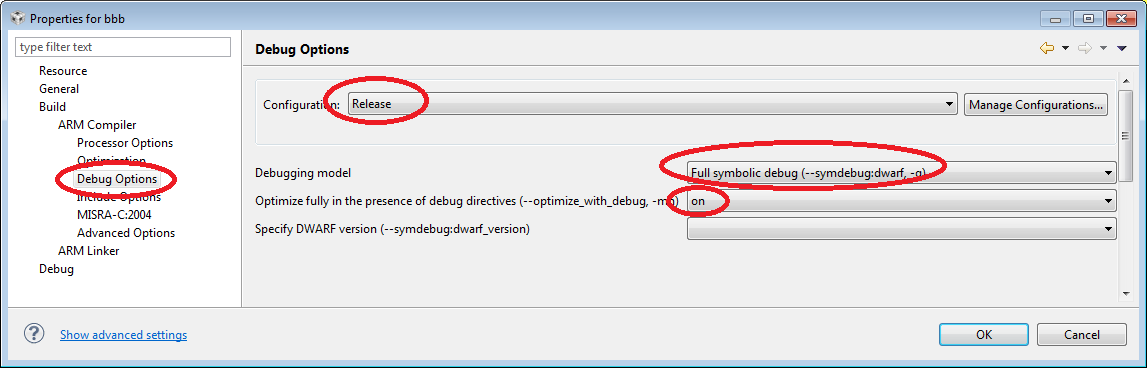
I use profiling now. I find that it only work in Debug (not release) configuration. Is it true? When I change to Release, there is no debug info, the profiling cannot work. Thus, this profiling is only a raw estimation, right? Please correct me if you know these issues.

Regards,

  • Robert,

    By default the release configuration will not have enough debug information to do function level profiling.  You could still use the profile clock.

    What you could do is change your release configuration to have full debug information (-g) but then also turn on optimization with debug.  This will enable you to then profile optimized code, the optimization is not as good as when -g is off but it is pretty good.

    Regards,

    John

  • I should revise my post.  To do function profiling you need to have a minimal amount of debug information.  I was just trying this out and skeletal debug information is enough.  So you don't need to turn on the full symbolic with optimize_with_debug.  You need that one if you want to be able to do any debugging.  But if you just want to profile then skeletal debug information is enough.  That should be the default value for the option if nothing is specified.  However you can also explicitly set it if you want.  Below is a capture of the option.  My previous capture was for ARM but I think you are on C6000 so this one is for the C6000 options dialog.

    With that option set I was able to do function profiling on a C64x+ simulator.

  • Thank you very much.

    I have a relevant question on Debug and Release. I think that these two configurations provided by CCS are convenient start points to modify many options. Am I right? How many differences between them?

    Can I set debug information option to skeletal in Debug, instead of Release mode to profile my code?

    I just am curious about the differences between Debug and Release? And pdf doc talks about these?

    Regards,

  • Yes the Debug and Release configurations are meant to be starting points.  You are free to modify them how you see fit and even create new ones.  So you can change the debug information of the "Debug" config to skeletal if you like, note that the Debug Configuration doesn't have optimization turned on by default so you would probably want to turn that on as well.

    You can even create a new config that is based on an existing one.  i.e. if you have already changed a bunch of options in the debug config and don't want to try to port them all to the release config to do profiling just do this:

    Right click on the project in the project view

    Select Build Configurations -> Manage...

    In the Manage dialog click on the New button

    Give the Configuration a name, maybe Profile.  Give it a description if you want.

    Select the option to copy settings from an existing configuration and select Debug

    Click ok.

    You will now have a new profile configuration that has all the settings from the Debug one.

    I would then change the Debug information settings to skeletal and turn on optimization to at least level 2.

    John

  • I have a query regarding ‘profiling feature of CCS V6.

    1. I profiled my code using,  'Debugging model' in 'Debug option' to ‘--symdebug:none’

    2. I changed the  'Debugging model' in 'Debug option' to ‘--symdebug:skeletal’ and profiled again.

    NOTE: ALL OTHER OPTIONS ARE SAME FOR (1) and (2). I have two '.c' files, Application and source. I am changing 'Debug Option' of my source file in (1) and (2). My Application is always in '--symdebug:skeletal'.

    The number of cycles i got in step (1) is less than half the cycles obtained in step (2).  But if we check the clock cycles usin 'Run->Clock' option, I am getting almost same cycles for (1) and (2). Which result is correct cycles for my code?