I am trying to use CCSv4.2.4.00033 on a workstation running
Windows 7 Pro, V6.1 (Build 7600). I am experiencing a unique
problem with increasing frequency.
My application is running out of flash on the hardware
target when I have to make changes to the source, and when I
am done I click on 'Project' >> 'Build Active Project' from
the drop-down menu. If there are no build-time errors I get
a dialog box, asking if I want to re-load, to which I
respond with [Yes].
This gives rise to a dialog box: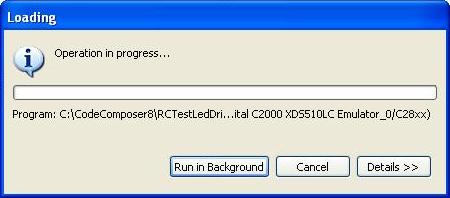
which looks much like the dialog I got when launching the
debug session, except I cannot give it input focus, I cannot
push any of the buttons visible on the screen, I cannot grab
the title bar & move it around; I can only wait until it
goes away and resume my debug session; which is what I did
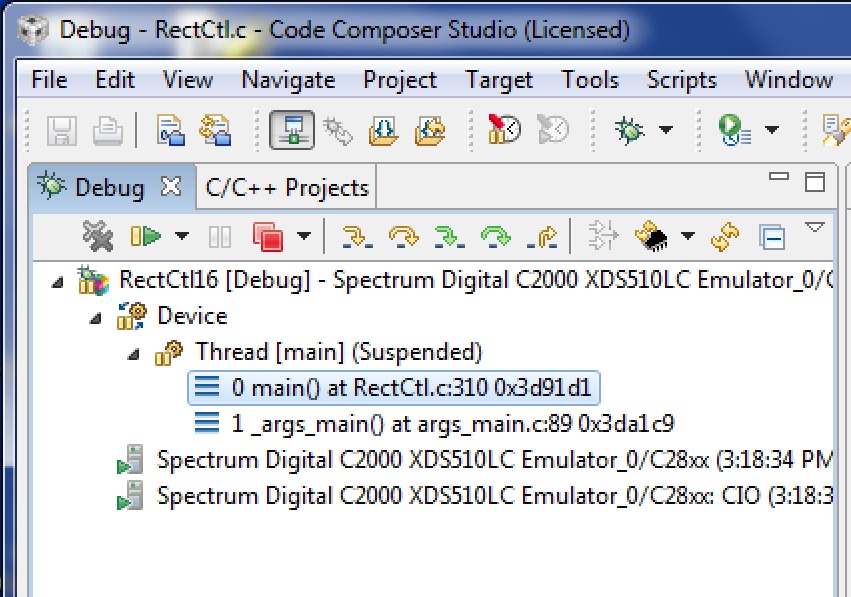
this time. We wind up with the 'Debug' tab visible and the
green 'Run' arrow is not dimmed, suggesting the debugger is
ready:
I want to stop my application 14 seconds after boot time and
have created an instruction just for this purpose, which is
where I plant my cursor in the source file and enter <Ctl>-R
from the keyboard. Only when, 14 seconds later, I don't hit the
breakpoint, do I realize something is wrong. I then notice
that the 'Run' arrow is still green, suggesting that <Ctl>-R
did not start it running after all. I try again and nothing
happens. I click on the 'Terminate All' button to no avail.
Finally I decide to shut down Code Composer completely,
which gives way to a dialog box that winds up looking like
this: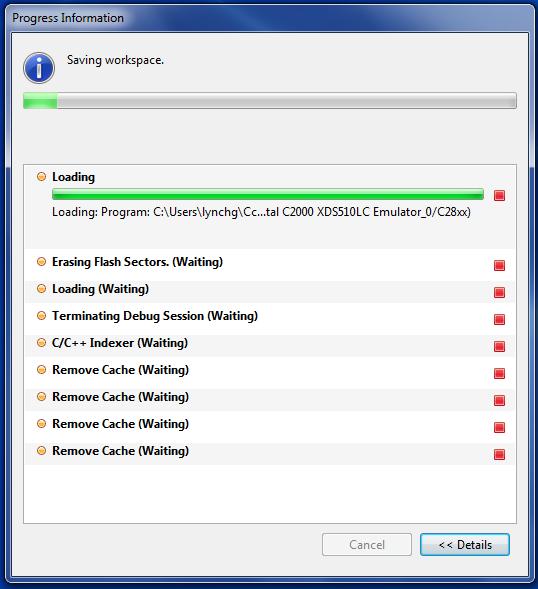
The pattern of red rectangles suggests that we never made it
to debug mode at all, and much of my recent effort was
meaningless. I want to know:
- Is there a way to force this 'Progress Information' dialog
box on-screen immediately: not after I terminate the
application?
- Failing that, is there a way to prevent CCS from
presenting me with a bogus indication that we are in debug
mode?
- If anyone is bold enough to propose a solution so this
never happens at all, that would be ideal.