


Other Parts Discussed in Thread: TMS320C6455, CCSTUDIO
The same C program, when I profile it withe ccs3.2 ccs3.3 and ccs5, I find the execution cycles become more and more.IS there anything wrong with the CCS version Or I am wrong?
在使用CCS的profiler时,同样的程序、同样的芯片类型,运行周期从CCS3.2到3.3到5.0,周期在不断变大。是C编译器的原因还是以前版本计算的不够准确?请求您给予一个解答,谢谢了!
韦志恒 weizhiheng99@yahoo.com.cn 中国科学院声学研究所 海淀区北四环西路21号
The dsp chip is tms320c6455
===========hello.c
#include <stdio.h>
//double a1=12.0;double b1=23.0;double c1=3.0;
int a1=12;int b1=23;int c1=3;
void jisuanAdd(){ c1=a1+b1;}
void jisuanMul(){ c1=a1*b1;}
void jisuanDiv(){ a1=c1/b1;}
void main(void) {
jisuanAdd();
jisuanMul();
jisuanDiv();}
============================= wei.cmd
-heap 0x2000
-stack 0x2000
-l rts64plus.lib
/* Memory Map 1 - the default */
MEMORY
{
L1D: o = 00f00000h l = 00008000h
L1P: o = 00e00000h l = 0000F000h
L2: o = 00800000h l = 00200000h
}
SECTIONS
{
.text > L2
.stack > L2
.bss > L2
.cinit > L2
.cio > L2
.const > L2
.data > L2
.switch > L2
.sysmem > L2
.far > L2
}
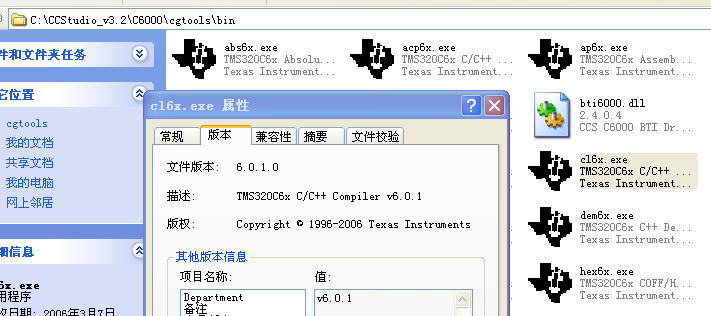
CCS3.2 compile
[hello.c] "C:\CCStudio_v3.2\C6000\cgtools\bin\cl6x" -g -fr"D:/CCC345/Debug" -d"_DEBUG" -mv6400+ -@"Debug.lkf" "hello.c"
[Linking...] "C:\CCStudio_v3.2\C6000\cgtools\bin\cl6x" -@"Debug.lkf"
<Linking>
Build Complete,
0 Errors, 0 Warnings, 0 Remarks.
Below is debug.lkf
-z -c -m"./Debug/CCC345.map" -o"./Debug/CCC345.out" -w -x -i"C:/CCStudio_v3.2/C6000/rtdx/lib" -i"C:/CCStudio_v3.2/C6000/csl/lib" -i"C:/CCStudio_v3.2/C6000/xdais/lib" -i"C:/CCStudio_v3.2/bios_5_21/packages/ti/bios/lib" -i"C:/CCStudio_v3.2/C6000/cgtools/lib"
"D:\CCC345\wei.cmd"
"D:\CCC345\Debug\hello.obj"
"C:\CCStudio_v3.2\C6000\cgtools\lib\rts64plus.lib"
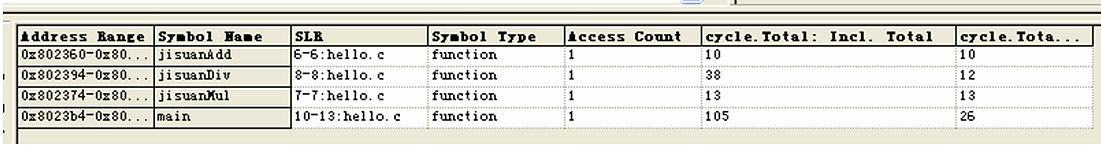
jisuan Add 10 cycles
jisuanDiv 38 cycles
jisuanMul 19 cycles
CCS5.0. Version: 5.0.1.201105110900
**** Build of configuration Debug for project TestFloat ****
C:\Program Files\Texas Instruments\ccsv5\utils\gmake\gmake -k all
'Building file: ../hello.c'
'Invoking: C6000 Compiler'
"C:/Program Files/Texas Instruments/ccsv5/tools/compiler/c6000/bin/cl6x" -mv64+ -g --include_path="C:/Program Files/Texas Instruments/ccsv5/tools/compiler/c6000/include" --diag_warning=225 --abi=coffabi --preproc_with_compile --preproc_dependency="hello.pp" "../hello.c"
'Finished building: ../hello.c'
' '
'Building target: TestFloat.out'
'Invoking: C6000 Linker'
"C:/Program Files/Texas Instruments/ccsv5/tools/compiler/c6000/bin/cl6x" -mv64+ -g --diag_warning=225 --abi=coffabi -z -m"TestFloat.map" --warn_sections -i"C:/Program Files/Texas Instruments/ccsv5/tools/compiler/c6000/lib" -i"C:/Program Files/Texas Instruments/ccsv5/tools/compiler/c6000/include" --reread_libs --rom_model -o "TestFloat.out" "./hello.obj" -l"libc.a" "../rts64plus.lib" "../wei.cmd"
<Linking>
'Finished building target: TestFloat.out'
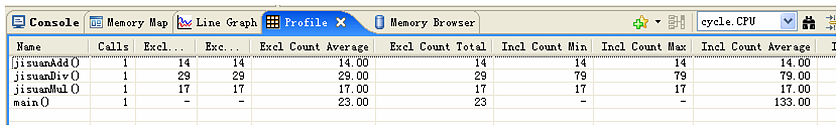
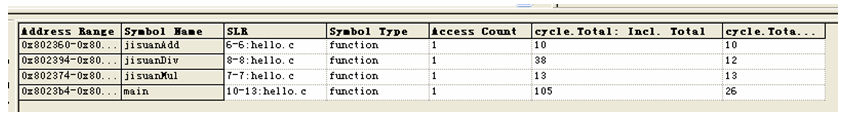
jisuan Add 14 cycles
jisuanDiv 79cycles
jisuanMul 17 cycles
If change the src file :
//double a1=12.0;double b1=23.0;double c1=3.0;
int a1=12;int b1=23;int c1=3;
to
double a1=12.0;double b1=23.0;double c1=3.0;
//int a1=12;int b1=23;int c1=3;
Can get: CCS3.2
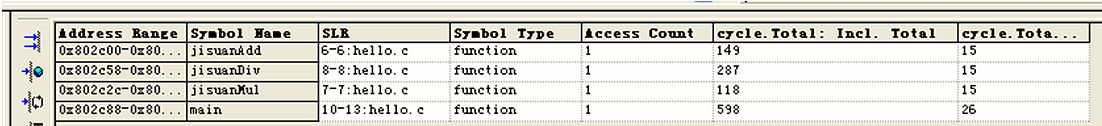
jisuan Add 149 cycles
jisuanDiv 287cycles
jisuanMul 118 cycles
CCS5
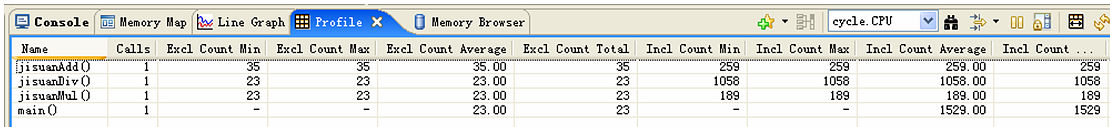
jisuan Add 259 cycles
jisuanDiv 1058 cycles
jisuanMul 189 cycles
IS THERE SOMETHING WRONG???
The function( jisuanDiv) execution cycle : from 287 change to 1058.
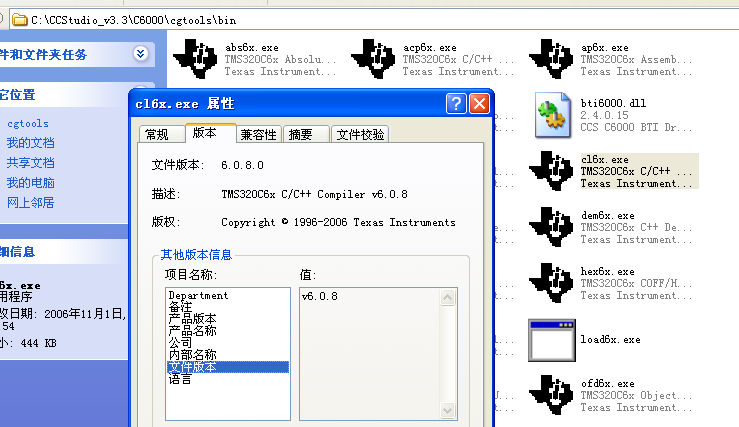
CCS3.3 compile
----------------------------- CCC345.pjt - Debug -----------------------------
[hello.c] "C:\CCStudio_v3.3\C6000\cgtools\bin\cl6x" -g -fr"D:/CCC345/Debug" -d"_DEBUG" -mv6400+ -@"Debug.lkf" "hello.c"
[Linking...] "C:\CCStudio_v3.3\C6000\cgtools\bin\cl6x" -@"Debug.lkf"
<Linking>
Build Complete,
0 Errors, 0 Warnings, 0 Remarks.
double
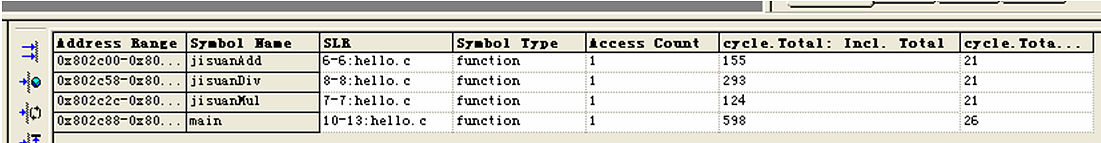
jisuan Add 155 cycles
jisuanDiv 293cycles
jisuanMul 124 cycles
int
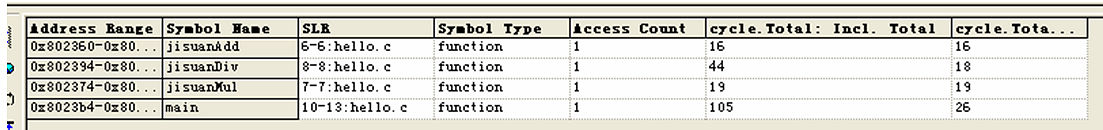
jisuan Add 16 cycles
jisuanDiv 44 cycles
jisuanMul 19 cycles

