This thread has been locked.

If you have a related question, please click the "Ask a related question" button in the top right corner. The newly created question will be automatically linked to this question.

How do I get stack debug information in CCS5


I need help figuring out how to get call stack debug information from CCS5.

I am developing an embedded app on a DM642 processor with DSP/BIOS 5.  It is a large application and has several libraries. At one point in its execution the app seems to freeze; however when I pause execution, it seems to be in the midst of a ridiculously large memcpy command.  I suspect, at least, the memcpy size argument has been improperly dereferenced (size being an address instead of a value) or corrupted (I have tried adjusting stack and heap sizes to no avail).

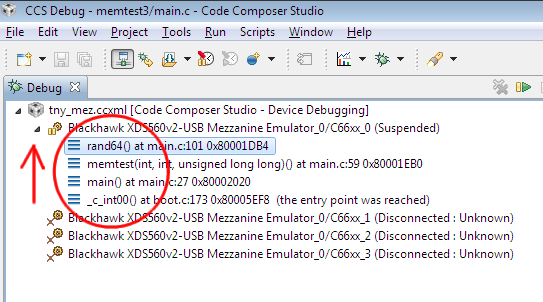
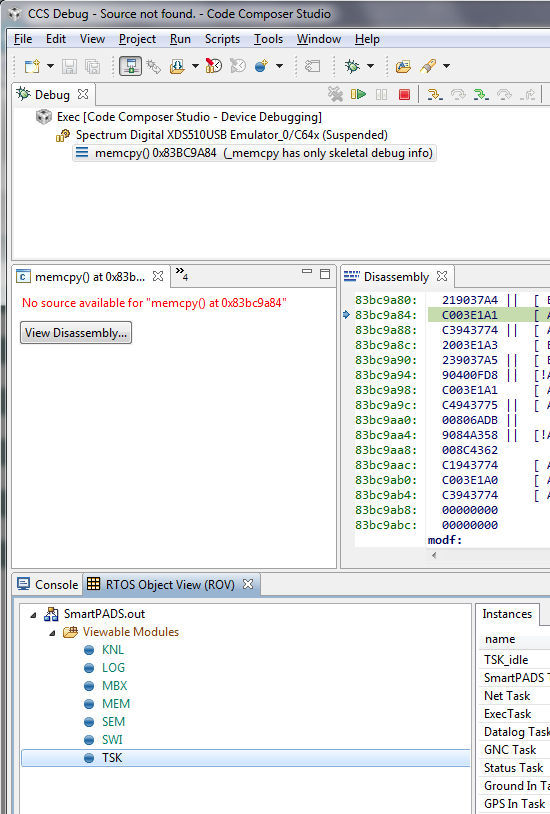
My problem is that I can’t find the offending statement.  When I pause, it just shows I am in the memcpy function with limited debug information (specifically nothing to show me what called it).

I suspect the memcpy is called internal to one of my third party libraries that was compiled without debug.

Is there a way to get call stack information (directly or indirectly) from CCS5 when I pause app execution in a library that has not been compiled with debug?

  • Hi Harry,

    My understanding, we usually see a call stack information as following in CCS 5 debugging perspective.

    In the example, _c_int00() called main(), main() called memtest() and so on.

    If you don't see this, please check if symbolic debug is enabled in compiler options (it exists in Basic Options branch in the Build -> C6000 Compiler).  Other possibility is the call stack information may be destroyed by some reason, but I'm not familiar with it.

    Best Regards,
    Atsushi

  • Atsushi,

          Thanks for responding.  My compiler was set for full symbolic debug (I tried 2 different selections).  This is a screen shot of what I get when I pause:

    There are indications that this memcpy or whatever corrupted it did other damage.  I can't browse mailbox information in RTOS ROV.

    Any Ideas?

    Thanks,

    Harry

  • Harry,

    I'm afraid that my suggestion did not help...

    If the DSP core has ETB (Embedded Trace Buffer), we can take real-trace but the following site says DM642 doesn't have ETB unfortunately.

    I will propose some general guidelines below.

    1. Could you check if stack size is large enough?  Insufficient stack size will often lead to a catastrophic error and it is usually hard to analyze.
    2. If the memcpy() is called appropriately, when executing the memcpy(), the register B3 should hold a return address to its caller.  We can guess where the memcpy() was called by refering B3 value.  If the address range near the B3 value does not contain any instructions to call memcpy(), we guess the memcpy() was not called by a regular fashion.  (Branched to the memcpy() by some irregular reason.)
    3. So-called printf() debug may help though it's not sophisticated way...

    Some coworkers may have additional better suggestions.

    Regards,
    Atsushi