


Hi,
I would like to display the 1-MHz sine-wave graphically in CCS 5.
The sine-wave array size is 400.
In "Graph Properties", I set:
Acquisition Buffer Size: 512
Display Data Size: 512.
Sampling Rate Hz: 5e6
Start Address: 0x800072E0
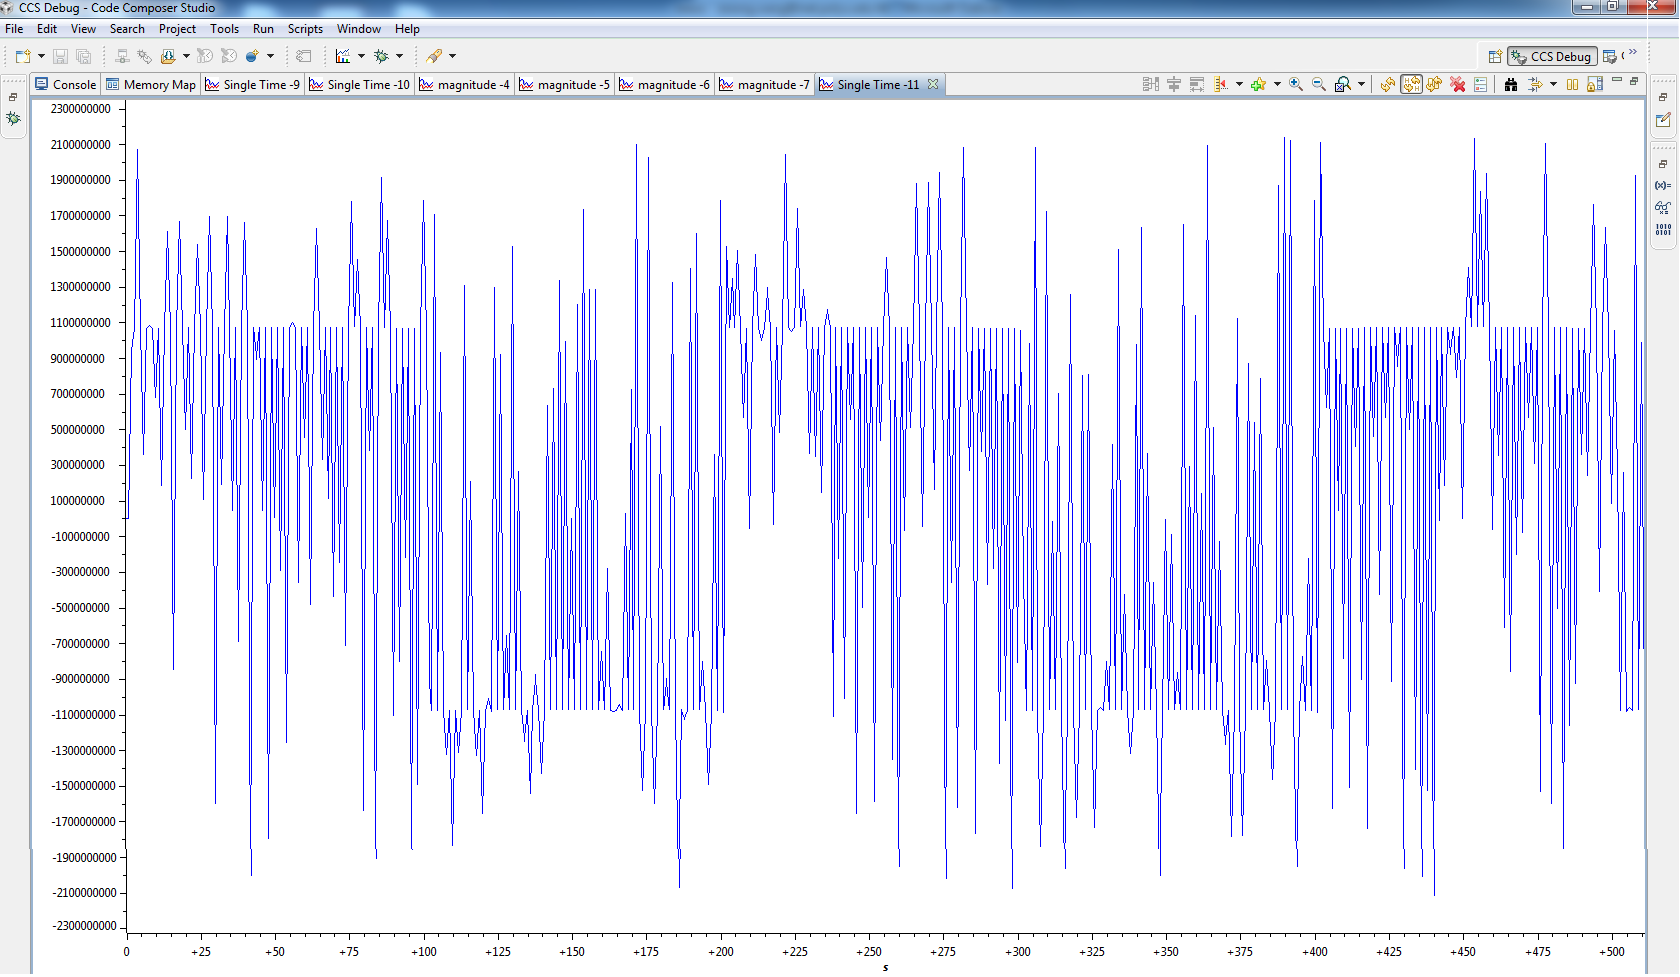
However, the graph is not a sine-wave.
I want to know that can I set 'Start Address' as the name of array or '& name of variable' ?
In addition, the FFT shape seems correct, but with very huge magnitude.
Thanks for your guidance.
PP

