This thread has been locked.

If you have a related question, please click the "Ask a related question" button in the top right corner. The newly created question will be automatically linked to this question.

Hello World Crashes

Other Parts Discussed in Thread: CCSTUDIO

Hello Texas Instruments:

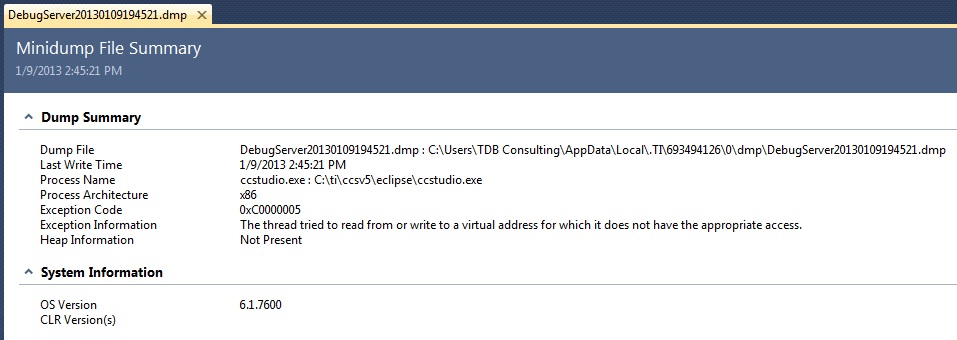
I noticed that a simple "Hello World" 'C' program executing in the Code Composer Studio version 5 Simulator will crash (or the debug buttons will go inactive) when attempting to print a number in the printed string as, for example:

printf("Hello World! %d\n", 5);

The crash will occurr even if the number is casted to an integer as: (int)5.

Can you tell me why the CCS Simulator will crash or the debug buttons go inactive without printing the string in the Console window for such a simple program?

I suspect it may have something to do with the compiler warnings listed below for HelloWorld.c:
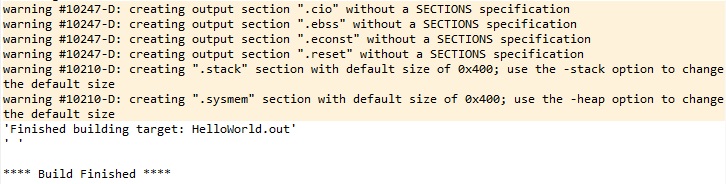
Thank you,

Tim

  • Hi Tim,

    you can certainly try increasing the stack/heap size.   Is this consistantly reproducable?  A couple things to help us debug here.  What simulator/exact CCS version are you using?   Would you be able to enable error logging and send us any generated error logs or dump files?  The wiki below will guide you with that

    http://processors.wiki.ti.com/index.php/Troubleshooting_CCS

    Best Regards,
    Lisa

  • Hello Lisa:

    It is not readily apparent in the Project Explorer or Project Properties or any other window or option how to increase the stack size. Will I need to write assembly code to do that?

    About 1/3 of the time the Hello World program will crash, the other times the Debugger buttons go inactive till I terminate the program.

    I followed the instructions to enable error logging. The last few lines in that file are given below and the last line indicates: ERT E: A crash occurred

    0x0000129C 393743 4 POLL I: Yielding to other threads 0x0000129C 393743 4 TMS320F283XX_0 POLL I: TimeToPollAgain() target is idle and needs polling in 0 ms 0x0000129C 393743 3 TMS320F283XX_0 POLL C: Polling with state STATE_RUNNING and status EVENT_DSP_STEP_OVER 0x0000129C 393743 3 TMS320F283XX_0 GTI C: GTI_STAT_EX( 0x37B04F20, 0x3562F540 ) 0x00000544 393774 3 XPCOM C: ( (dsIBreakpoint*)3617F248 )->DescriptionBitfield( 3B70F7D8 ) 0x0000129C 394273 1 ERT E: A crash occurred - dump file written to "C:\Users\TDBCON~1\AppData\Local\.TI\693494126\0\dmp\DebugServer20130109194521.dmp"

    The contents of the "dump file" referred to above is shown below:

    (Unfortunately the Insert Image option above is now not working).

    If the problem is due to the stack size, how is it increased?

    Thank you,

    Tim


  • Hi Tim,

    could you please send us the .dmp file?  Offline is also possible as my ID is a link you can use to start a conversation or friend request.

    You can see the heap behaviour in two areas (sorry for not being more specific)

    1 - Window->Preferences->General ... show heap status

    2 - Project->Properties->xxxxx Linker->Basic Linker Options

    Best Regards,

    Lisa

  • Hello Lisa:

    How do I email the file to you? The Forum emails I get indicate not to reply (i.e. noreply@e2e.ti.com).

    Also, can you give me a hint how to increase the stack size?

    Thank you,

    Tim

  • Hi Tim,

    I just connect with you offline so you can send the dump file which is the best next step to check.   What target do you use?  The stack and heap are both on the same tab for the msp430 for example.  See this post

    http://e2e.ti.com/support/development_tools/code_composer_studio/f/81/p/215845/761422.aspx#761422

    Best Regards,

    LIsa

  • Hi Lisa:

    The target is the CCS Simulator. The post at the link below shows EXACTLY how to set it up to run:

    http://e2e.ti.com/support/development_tools/code_composer_studio/f/81/p/85359/827162.aspx#827162

    Note that I had to type that entire link in manually because it is not possible (?) to simply copy and paste on this page.

    I will attempt to increase the stack size using the information given at the link you provided.

    Thank you,

    Tim


  • Hi Tim,

    I have never had an issue here with cut and paste, but regardless, try the stack/heap sizes and we will await the crash dump file to go further.

    Best Regards,

    Lisa

  • Hello Lisa:

    I incrementally increased the stack and heap to 10K and the program still fails.

    The compiler gives several warnings about creating sections without a SECTIONS specification.

    Where do I set the "SECTIONS specification"?

    Thank you once again,

    Tim

    P.S. Incredibly, the text I attempted to paste on this page several seconds ago eventually appeared as shown below:

    warning #10247-D: creating output section ".cio" without a SECTIONS specification

    warning #10247-D: creating output section ".ebss" without a SECTIONS specification

    warning #10247-D: creating output section ".econst" without a SECTIONS specification

    warning #10247-D: creating output section ".reset" without a SECTIONS specification


  • Hi Tim,

    warnings can usually be ignored.  The SECTIONS are created in the linker command file (.cmd file) however I would make modifications with extreme caution.  This is usually automatically selected for you. 

    As mentioned, what could hopefully tell the story is the .dmp file.

    Thanks,
    Lisa

  • Hi Lisa:

    I received an email message in which you (evidently) wrote the following:

    Hi Tim,

    you can send it to us here.

    Cheers,

    Lisa

    I replied with the dump file.

    Did you receive it?

    Thank you

  • Good Morning Lisa:

    Shall we continue where we left off?

    Thank you for your time and efforts,

    Tim

  • Good morning Tim,

    no I see no replies to the conversation I opened up with you online there.  Would you please try again as the dmp file is really the best next debug step.

    Best Regards,
    Lisa

  • Hello World:

    If you too have problems inserting an image on a TI Forum page, try deleting the "cookies" on your computer.

    It worked for me.

    Take care,

    Tim and Spencer at TDB Consulting (http://TDBConsulting.org/)

    P.S. Meet Spencer:


  • Hello Lisa:

    The image below is of the Dump File. (NoteTo insert an image, it is necessary to delete the "cookles" on the computer each time an image is inserted):


  • And, apparently, the image cannot be too large, otherwise, it will not display as in the previous eposode.

    Let's see if the image below will display...

  • Hi Tim,

    we need the actual .dmp file in order to investigate.  I will wait to continue on the offline portion of this thread for the file.

    Thanks,
    Lisa

  • Hi Lisa:

    Ok, I will go to your Online Offline Line and try to send the Dump File to you.

    Thank you,

    Tim & Spencer

  • Hi Lisa:

    Have you had any luck with that Dump File for determining why the computer crashes (or the Debug buttons are deactivated (except for Terminate (Ctrl+F2))) when printing a number in a string? For example:

    printf("Hello World! %d\n", 5);

    Since the compiler was complaining about not having a "SECTIONS specification" and since the Simulator does not create a command (.cmd) file, which normally contains that "SECTIONS specification", is it possible that a command file needs to be generated manually so the Simulator will not cause the computer to crash (or the Debug buttons are deactivated)?

    Appreciatively,

    Tim

  • Hello Lisa:

    I have not yet received a response to the post below and was wondering if you received it:


    Hi Lisa:

    Yes, I can do as you requested.

    However, wouldn't it be much more effective and efficient if someone at Texas Instruments wrote the 5 lines of code below,  execute it, and watch it crash?

    #include <stdio.h>

    int main(void) {

       printf("Hello World! %d\n", 5);

       return 0;

    }

    Below are the steps required to execute Code Composer Studio (CCS), create the CCS Simulator Target Configuration, create the CCS Project (e.g. HelloWorld) for and build the code (i.e. Hello World above), and execute the CCS Debugger :

    1. Execute CCStudio.exe (i.e. click on cube icon)

    2. Workspace Launcher window appears 

       a. Select Workspace (e.g.): C:\ti_Workspace  

       b. Click: OK

    3. Create Target Configuration for Target (i.e. Emulator Connection and Device) 

       a. Click menu item: View -> Target Configurations  

       b. Target Configurations window appears     

          1. Click button (upper right side): New Target Configuration File     

          2. New Target Configuration window appears        

             a. Set File name (default): NewTargetConfiguration.ccxml       

             b. MUST leave checked: Use shared location        

             c. Click: Finish        

             d. NewTargetConfiguration.ccxml Basic General Setup window appears           

                1. Set Connection: Texas Instruments Simulator           

                2. Check Device: F283x CPU Cycle Accurate Simulator           

                3. Click: Save        

             e. Close NewTargetConfiguration.ccxml window     

          3. In Target Configurations window        

             a. Expand directory: User Defined        

             b. Right-click: NewTargetConfiguration.ccxml        

             c. Click: Set as Default  

       c. Close Target Configurations window

    4. Create Project and Build  

       a. Click menu item: Project -> New CCS Project  

       b. CCS Project window appears     

          1. Set Project name (e.g.): Test     

          2. Set Device Family: C2000     

          3. Set Variant: Generic 28xx Device     

          4. Set Project templates and examples:        

             a. For C language: Empty Project (with main.c)        

             b. For Assembly: Empty Assembly-only Project     

          5. Click: Finish     

          6. Main.c window appears  

       c. Build Project     

          1. Click menu item: Project -> Build All     

          2. Console CDT Build Console window appears

    5. Execute Debugger using compiled Project code while utilizing the Simulator (as set as default User Defined Target Configuration)

       a. Click menue item: Run -> Debug (or click Debug icon)

          NOTE: The Debugger will not execute by opening the Debug window by clicking menu item: View -> Debug

       b. Step through the code using the Debug window icons (or function keys)

    Thank you,

    Tim

  • Hi Tim

    it would actually be great to have the error logs, but I do have it planned to try this next time I am at my actually computer.

    I will keep you informed.

    Best Regards,

    Lisa

  • Hi Lisa:

    Thank you for your response.

    The error log file is attached.

    I look forward to getting this issue resolved and to get back on schedule for the client.

    Appreciatively,

    Tim

    P.S. I had to clear the cookies again to be able to attache the file.

    0310.DebugServer.log

  • Hi Tim,

    I have a couple updates.   First I was unable to reproduce a crash on my win 7 machine with v5.3.   The only thing I did see was that CCS seemed not to want to step into the printf function but there was no crash and ccs did not become unresponsive.   The log seems to show you are crashing in the simulator so I am going to have to ping the simulation team here for further investigation/help.

    Best Regards,
    Lisa

  • Hi Lisa:

    Thank you for the update.

    I am running Windows 7 too.

    I look forward to hearing what your Simulation team discovers.

    Thank you very much,

    Tim


  • Hi Lisa:

    Any news from your Simulation team?

    In the meantime, could you attach the software source code file that you used which did not cause the Debugger to crash and did not cause the debug buttons to go inactive?

    Thank you,

    TIm

  • Hi Tim,

    no real feedback yet, but it is expected it might take a bit of time as the development teams are always super busy.  The only thing I have to report is simply that we do have a pc which shows a crash/hang here so this is still being investigated.


    I cut and pasted your code following your instructions so I don't think it is the project but rather the environment/a simulator bug perhaps.

    Best Regards,
    Lisa

  • Hi Lisa:

    Thank you for the update.

    We (the client and I) hope the issue can be resolved soon.

    Tim Ball

    TDB Consulting

  • Hi Tim,

    Looks like both data and prog memory are being mapped to the same space due to invalid linker rules , and the application is writing into the program space and corrupting it.

    Basically , a valid linker command file is not being picked up during the creation of the executable.To pick it up , please do :

    1.Right click on the CCS project  and Add Files ,select the lnk.cmd file which will be under :

    tools\compiler\c2000_6.1.0\lib\

    2.clean and recompile

    With the executable created using the above steps, the issue that you observed seems to go away.


    Thanks!

    Simualtion Team.


  • Hello Texas Instruments Simulation Team:

    Thank you for the crucial information to get the Debugger for the CCS Simulator to work properly without crashing (or deactivating the debug buttons) when simply printing a number. I am surprised that the issue had not surfaced sooner.

    The file lnk.cmd actually resides in the directory <installation directory>\ccsv5\tools\compiler\c2000_6.1.0\lib\ and the "File Operation" used to "Add Files..." can be either "Copy files" or "Link to files". I prefer the "Copy files" option to have all files for the project in a single directory. That is apparently not possible when creating a Target Configuration for a Target (i.e. Emulator Connection and Device) for the CCS Simulator.

    Thank you all for all your time and efforts in this matter,

    Tim Ball

    TDB Consulting