This thread has been locked.

If you have a related question, please click the "Ask a related question" button in the top right corner. The newly created question will be automatically linked to this question.

Suggestions for improved developer velocity


Hi guys. 

My first post, wee :)

I'm not sure that this is the right place but seems like it.

I'd like to post a suggestion to code composer studio to make it not so much pain in the behind.

Starting with this:

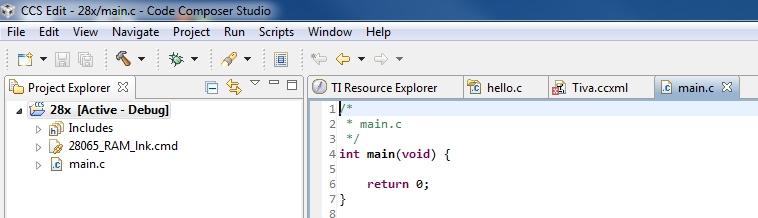
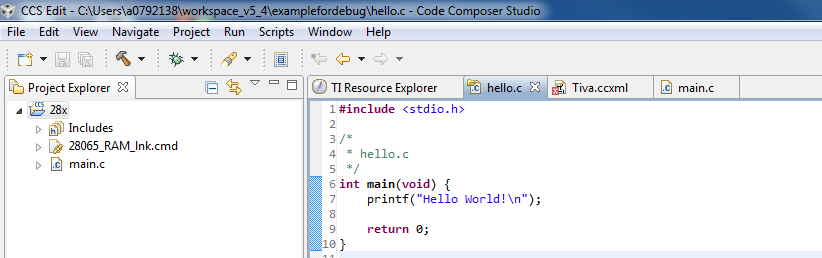
Sometimes when debugging a project, the active project you're debugging loose focus. This gives an error and I need to start all over. It's not super much time ~½ min. But when it's relatively often it becomes quite an annoying problem. Could you please fix this?

BR, Carsten

  • Carsten,

    Welcome to the forums!

    I have seen a couple scenarios where CCS will lose context.

    Are you talking about the case where it will stop highlighting the active project in the project explorer?  i.e. in the first capture below it has the context but in the second it does not.

    In this particular case the active project is not highlighted in the second capture as the source file I have selected is not part of any project I have open.

    I have also seen the debug view lose context before as well.

    What is the error message that you are getting?

    Regards,

    John

  • Hi John.

    Sorry for the late reply. I've been on vacation a couple of weeks. 

    But ok, then I think I know the reason. Which is that when debugging a source file CCS creates this "mirrored" debug source file which isn't defined as being a member of the active project. So when switching between normal source files and the "mirrored" source files. the active project looses focus and you have to activate it again.

    Which leads me to another annoying point that probably arises from the same cause that you can't set valid debug breakpoints in normal source files if you're in CSS Edit view.

    BR, Carsten

  • Carsten,

    It sounds like there is a source association problem.  Normally you can set breakpoints ok in the Edit View and then when the debugger launches it will then associate them with a debug context (i.e. really set them).

    If this is the problem then it would definitely cause issues with the active project selection as well.  If I have main.c which is part of my project open and I click on the tab for hello.c which is not part of that project then I will lose the active project selection.

    Just to confirm it is a source association issue could you try the following:

    Open a source file

    add a while(1) loop to your app.  

    Leave the source file open

    Build and launch the debugger.

    Run and then halt the application.

    Did CCS open up another copy of the source file that had the loop in it?

    John

  • Hi John.

    I have an auto break point @ main(). When it breaks here it is in a copy of the source file.

    BR, Carsten

  • Any chance I could get the project and .out?  I would like to take a look a the symbol info and see why CCS is opening up another copy of the file.  It can find the file since it opens the copy but why it needs to open it again is odd.

    When you put your mouse over the file tab does it show the same path for both files?

  • Hi John.

    Sorry can't give you the files :)

    But yes the file and it's mirror file seems to be located different places. Could it be related to virtual paths somehow then?

    The two files have different icons as well:

    BR, Carsten

  • Can you show the full paths in the tooltip?  i.e. the paths where CCS thinks each file is located.  What do you mean by virtual paths?

    As far as the icons the one on the left means it is not associated with a project, is that the one that was opened by CCS when debugging (i.e. the second one that was opened)

    Thanks,

    John

  • G'day John, how are you doing this day? :)

    I've taken a couple of screen dumps for you:

    The first file have a full path whereas the 2nd one is defined from some other place than C:/. 

    The first pic I had to cover two directories and the 2nd is only one. - Sry have to be on the safe side or I can get my beehind kicked :| ... ;)

    By virtual I just mean that CCS might mess something up by having the direct path c:\.. bla bla and the virtual path $ROOT to juggle with (just a hunch).

    BR, Carsten

  • Hello Carsten, 

    The file with ".c" icon shows the path that is workspace relative. It is usually projectname and then source file (optionally subfolder names if you have any in your project). We would like to see what this path resolves to. The easiest would be to right click on iCU_LM3...cpp file in your project and choose properties, then choose "Resource" in left hand category box, if it is not already selected. The right hand side screen should show a few different path information. We are interested in "Resolved Location". Could you compare it to the path shown in the tooltip of the file that pops up during debug? I think this would be the C:\projects. Another way that you could check is what is getting passed to the compiler during build. If you build your project, then in build console you should see a listing for each source file being built with various compiler options, one of the items listed should be absolute path to the .cpp file. All of these should resolve to the same absolute path. Could you let us know whether this is the case? 

    Also, could you let us know which version of CCS you are using? 

    Thank you,

    Martin

  • Hi Martin.

    The paths are identical via your first method at least.

    I'm running CCS  Version: 5.4.0.00091.

    BTW the error I get since CCS looses focus on the active project is this:

    BR, Carsten

  • Hello Carsten,

    While you are debugging can you:

        open the Modules View

        expand the node “<Your Program>/Files”

        select the node “iCU_LM3S9D96.cpp”

    Copy and the text in the right side pane – something like:

           Relative Path: ../main.c

           Compilation Path: C:\Eclipse_Envs\ccs_6x_latest\workspace_run\c64x_test\Debug

    Paste the text in this thread.

    This might give me clues that will help me reproduce your issue.

    Thanks

    Dobrin

  • Hello Carsten, 

    My apologies for delayed response. Dobrin is the expert on source search path issues. 

    Regarding the error that you are seeing. ${project_loc} macro is dynamically populated based on currently selected project in project explorer. If there is no active selection in project explorer (i.e. there is no project that has bold font), then that macro is not valid. Most likely that is not what you want. I would suggest that you use PROJECT_LOC instead, the case does matter or PROJECT_ROOT. This is a project static macro that should not change based on selection. Maybe project_loc is also introducing some issues with building that maybe are confusing source search paths. 

    Martin