This thread has been locked.

If you have a related question, please click the "Ask a related question" button in the top right corner. The newly created question will be automatically linked to this question.

Not able to open debug console in CCS5.4


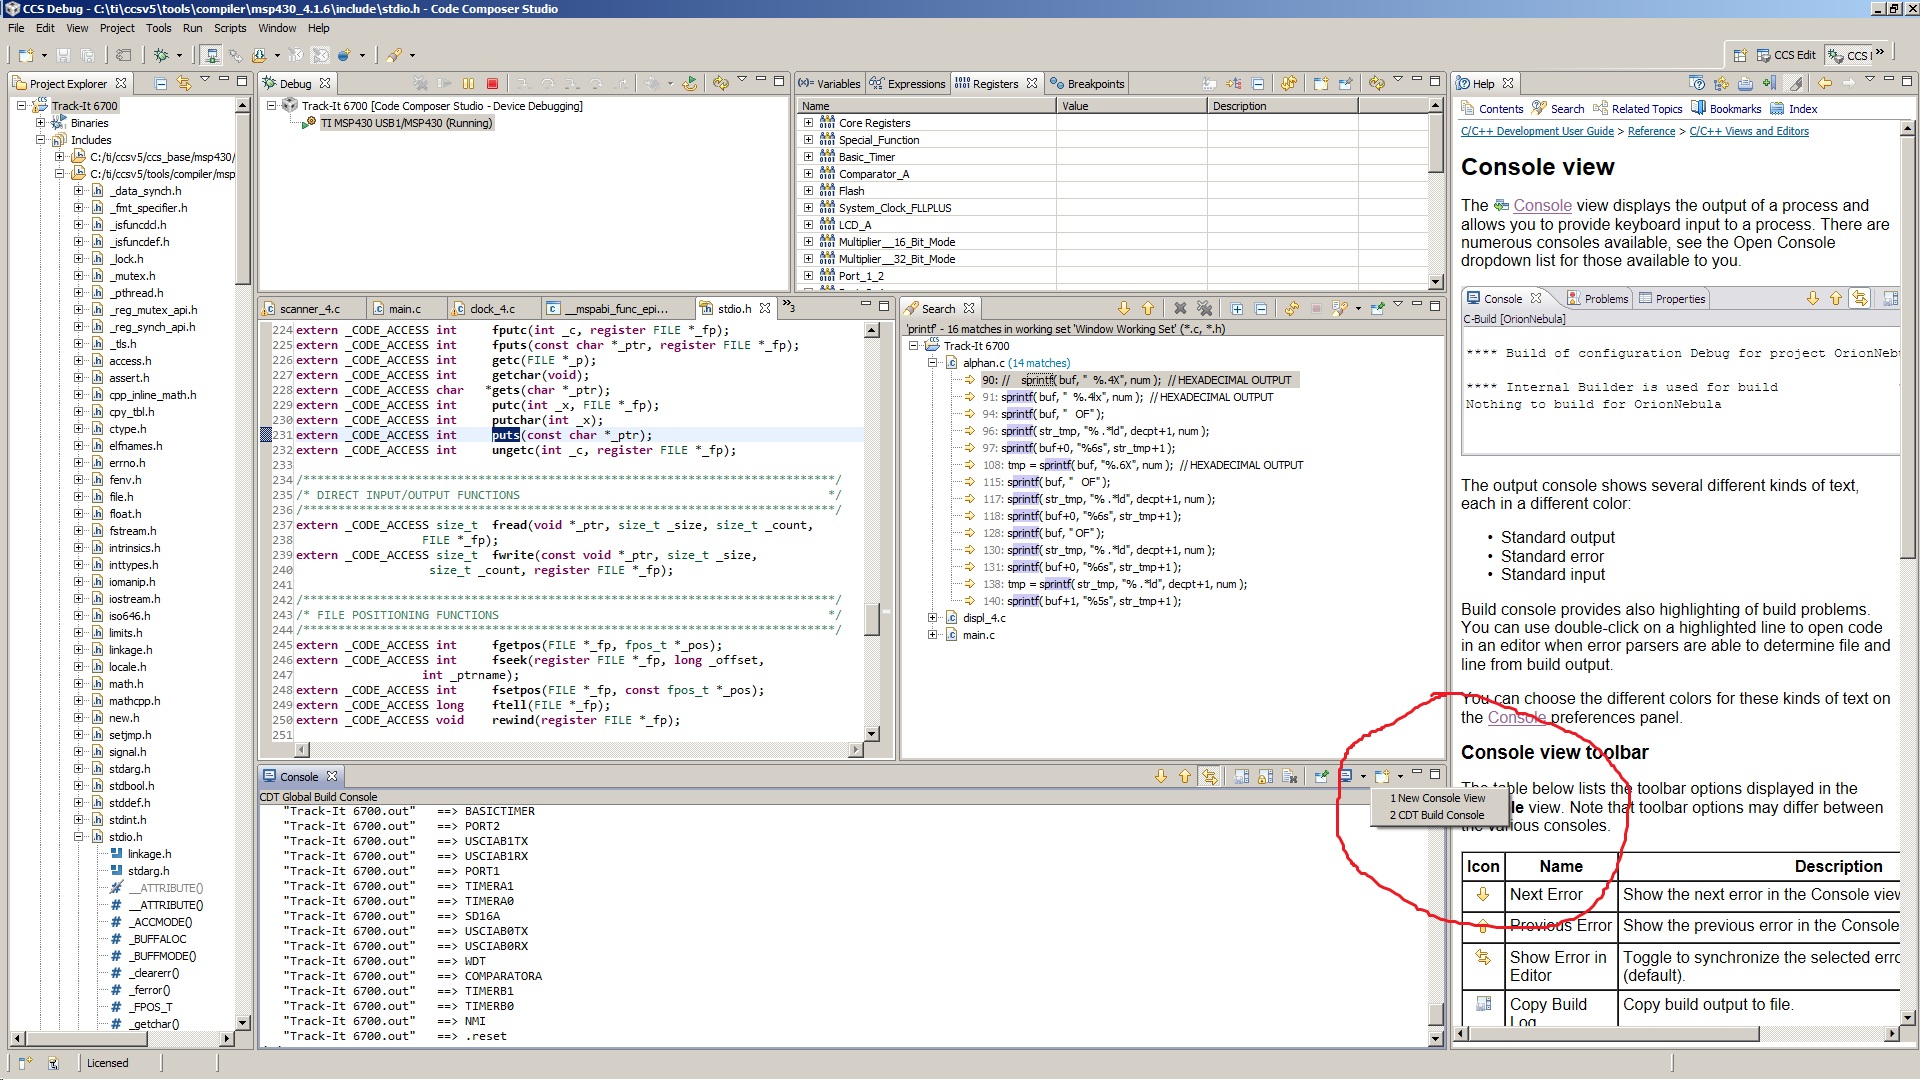
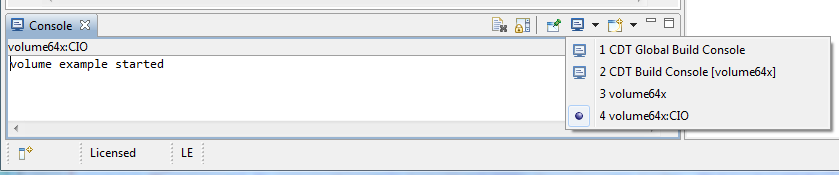
I have checked the "Enable CIO" checkbox, however clicking on the "Open Console" shows only CDT Build console options.

I am using:  Version: 5.4.0.00091 

MSP 430F4794

MSP_FET430UIF

Windows 7

  • Hi Corky,

    would you be able to expand a bit on what you are experiencing?   Eg, are you in the ccs debug mode/perspective?  Would you be able to send screen captures?

    Best Regards,
    Lisa 

  • This is the screen shot of the debug perspective in debug mode. It shows that there is no debug console available in the "Open Console" pull down.

  • Hi Corky,

    would you please try again?  It seems the attachment did not work.

    Best Regards,
    Lisa 

  • Lisa,

    Sorry I don't know why the attachment did not work. I'll try again.

    Thanks,

    Corky

  • Hi Corky,

    what if you select "new console view"?  Also, it seems like you are getting CIO output to the console ...

    Best Regards,
    Lisa 

  • Lisa,

    Selecting "New Console View" just shows a new copy of the Build output. The puldown does not show the options that are shown in the Help for this function.

    Regards,

    Corky

  • Hi Corky, 

    Given that you have shown printfs in your screen capture. I am guessing you want to see printf messages rather than "Debug" console. There is something that we have been calling debug console but it is limited to debugger messages. e.g. when target communication fails or one of the views attempts to make invalid memory request. There is a separate console for CIO (i.e. printf) messages. Both Debug and CIO consoles are dynamically created based on need. Thus unless there is something to show they do not get created. Picture below shows both consoles after they are created.

    My suggestion would be to focus on your target application. It appears that the device that you are using has minimal printf support and relatively small default heap setting. Printf can use quite a bit of heap, thus it is possible that your device can't handle what you trying to print. CIO also uses a breakpoint to trigger data transfer (roughly set somewhere inside of printf function). Thus if that breakpoint setting fails then printf would not work either. 

    Martin

  • Lisa,

    Your screen shot shows that it is possible to select a CIO window from the pull down menu. My screen shot does not look like yours, or the one in the help, in that a CIO window is not shown as an available choice. I am aware of the printf() limitations, but I use sprintf() elsewhere in the program ( with no floating point support). To clarify, my issue does not seem to be with printf(), but how to get the debugger to display the CIO window.

    Regards,

    Corky