This thread has been locked.

If you have a related question, please click the "Ask a related question" button in the top right corner. The newly created question will be automatically linked to this question.

DM8148 DSP debug

Hi Sir :

I work on DM8148 platform and use DVRRDK_03.00.00.00 to develop our system.

And we want to use xds 100V2 and ccs 5.2.1.00018 to debug dsp in ubuntu platform.

Below is my debug steps.

1.Power on TI8148 EVM board and execute ./init.sh and ./load.sh to release dsp from reset.

2.Start CCS5 v2 and chose File->New->Target Configuration File

3.Select xds100 v2 emulator and EVMDM8148 and lunch *.ccxml
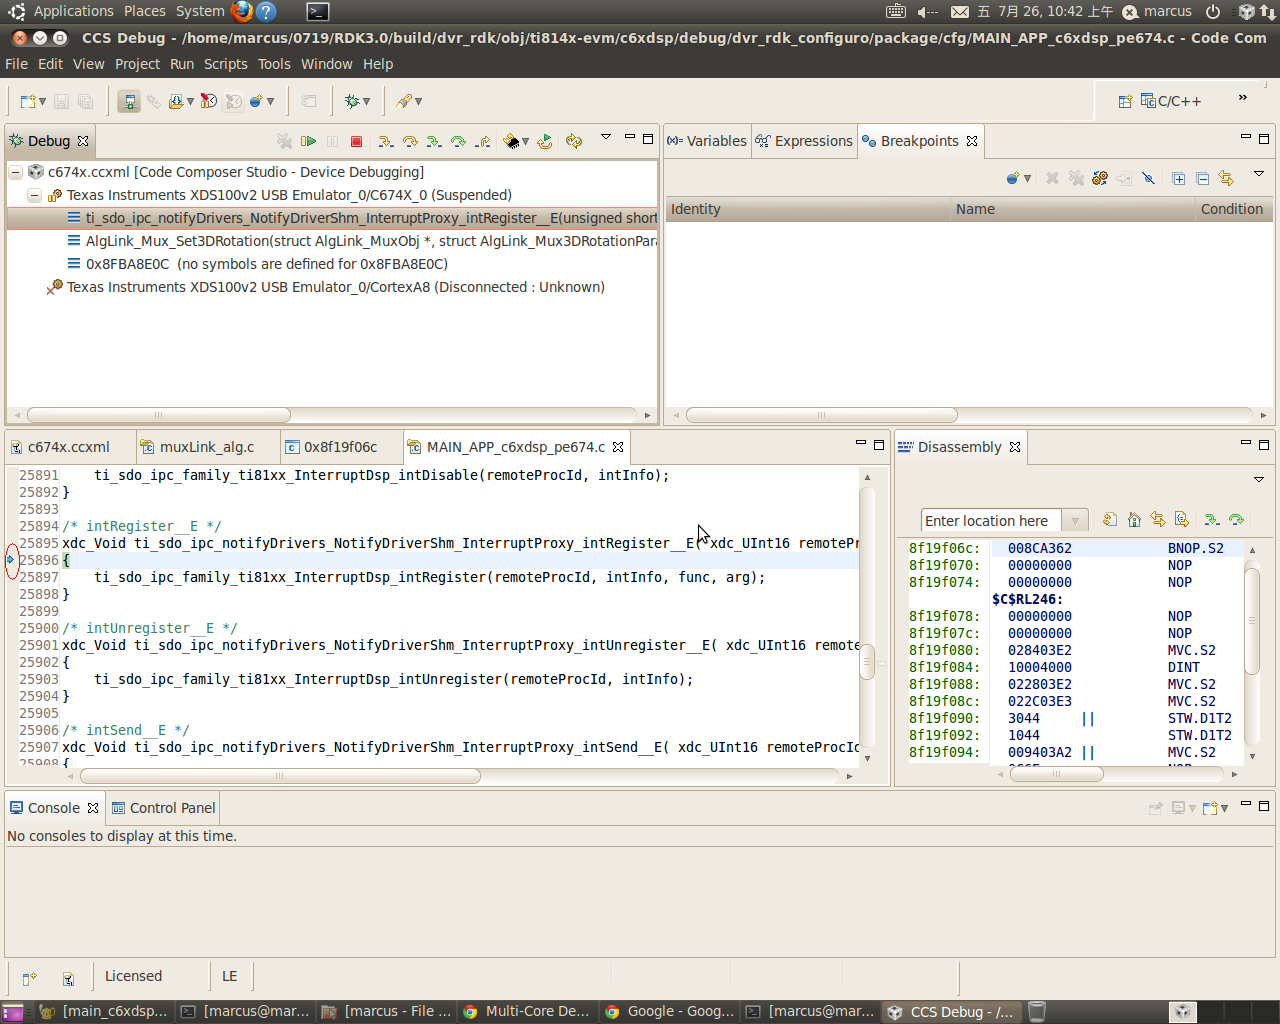
4.Connect C674x_0

5.Chose Run->Load->Load Symbols and chose dvr_rdk_fw_c6xdsp.xe674. (I do not know if the file I chose is correct)

6.Press F8

After these steps, there is no response on CCS, I know maybe I do not assign source path for DSP.

My question is that is there any detail document that describe how to debug DSP on DM8148?

Or, could you kindly tell me the detail process on how to debug DSP on DM8148?

Best regards,

Marcus


  • Hello,

    lu yuenjune said:
    5.Chose Run->Load->Load Symbols and chose dvr_rdk_fw_c6xdsp.xe674. (I do not know if the file I chose is correct)

    You mention you are loading only symbols. Is the code already on the target?

    ki

  • Hi Ki :

    I appreciate your reply.

    About your question, the answer is yes, the code already on the target.

    Because DSP must release from reset and I can debug DSP.

    I refer the link below and rebuild dvr_rdk_fw_c6xdsp.xe674.

    http://e2e.ti.com/support/dsp/davinci_digital_media_processors/f/717/t/214318.aspx

    When I load the symbols, it seems I can start debug because there is a break point appear on the screen.

    I am not sure what I have done is correct because this break point will change on different file when I stop debug and then start debug.

    Since I only want to debug alg and as I know DM8148 is a multi-core platform.

    Could you kindly tell me how to debug DSP alg in DM8148 platform?

    Or, could you show me the whole steps to debug dsp?

    Best regards,

    Marcus

  • lu yuenjune said:

    When I load the symbols, it seems I can start debug because there is a break point appear on the screen.

    If your have loaded the correct symbols for the code on the target, this should work. I'm not sure why a breakpoint is automatically appearing on the screen on a program load however.

    lu yuenjune said:
    I am not sure what I have done is correct because this break point will change on different file when I stop debug and then start debug.

    Are you referring to the program counter arrow in the editor? This would appear wherever you halt the program.

    lu yuenjune said:
    Since I only want to debug alg and as I know DM8148 is a multi-core platform.

    The key thing to be aware of regarding multi-core debug is the debug context. Multi-core debug basics is covered in this wiki topic:

    http://processors.wiki.ti.com/index.php/Multi-Core_Debug_with_CCSv5

    In any case, it is difficult to provide any useful suggestions since I am unfamiliar with your environment. You may also want to post your question in the DM814x forums. The people there will be more experienced with your setup and likely have better suggestions about debugging the DSP of the DM8148.

    good luck

    ki

  • Hi Ki :

    Thanks for your reply!

    When I load the symbols, it seems I can start debug because there is a break point appear on the screen.

    The picture below can show the situation and break point is in red circle.(I am not sure if it is break point)


    You can see that after I load the symbol "dvr_rdk_fw_c6xdsp.xe674", I can use step into, that's why I think it is a break point.

    However, when I press F8 "Resume" to run DSP, I can not debug anymore.

    Could you tell me if what I done is correct?

    And I will post this issue on DM8148 forum.

    Best regards,

    Marcus

  • lu yuenjune said:

    When I load the symbols, it seems I can start debug because there is a break point appear on the screen.

    The picture below can show the situation and break point is in red circle.(I am not sure if it is break point)


    That is NOT a breakpoint. It is a blue arrow indicating the location of the program counter (where you are halted in your code)

    lu yuenjune said:
    You can see that after I load the symbol "dvr_rdk_fw_c6xdsp.xe674", I can use step into, that's why I think it is a break point.

    After you loaded the symbols, the target is halted and CCS will show you where you are halted in your source code with that blue arrow.

    lu yuenjune said:
    However, when I press F8 "Resume" to run DSP, I can not debug anymore.

    If the target is running, you will not have any debug visibility. You'll need to halt the target again. What happens when you halt?

  • Hi Ki:

    I appreciate your help!

    Since I have posted this issue on DM8148 forum and there is someone who can answer my question.

    Anyway, thanks very much!

    Best regards,

    Marcus