This thread has been locked.

If you have a related question, please click the "Ask a related question" button in the top right corner. The newly created question will be automatically linked to this question.

Displaying graphs issue

Hi,

 As, i am new to CCS environment, i was trying to implement the instructions as guided on the 'GCS:Debugging projects' page on TI Wiki.

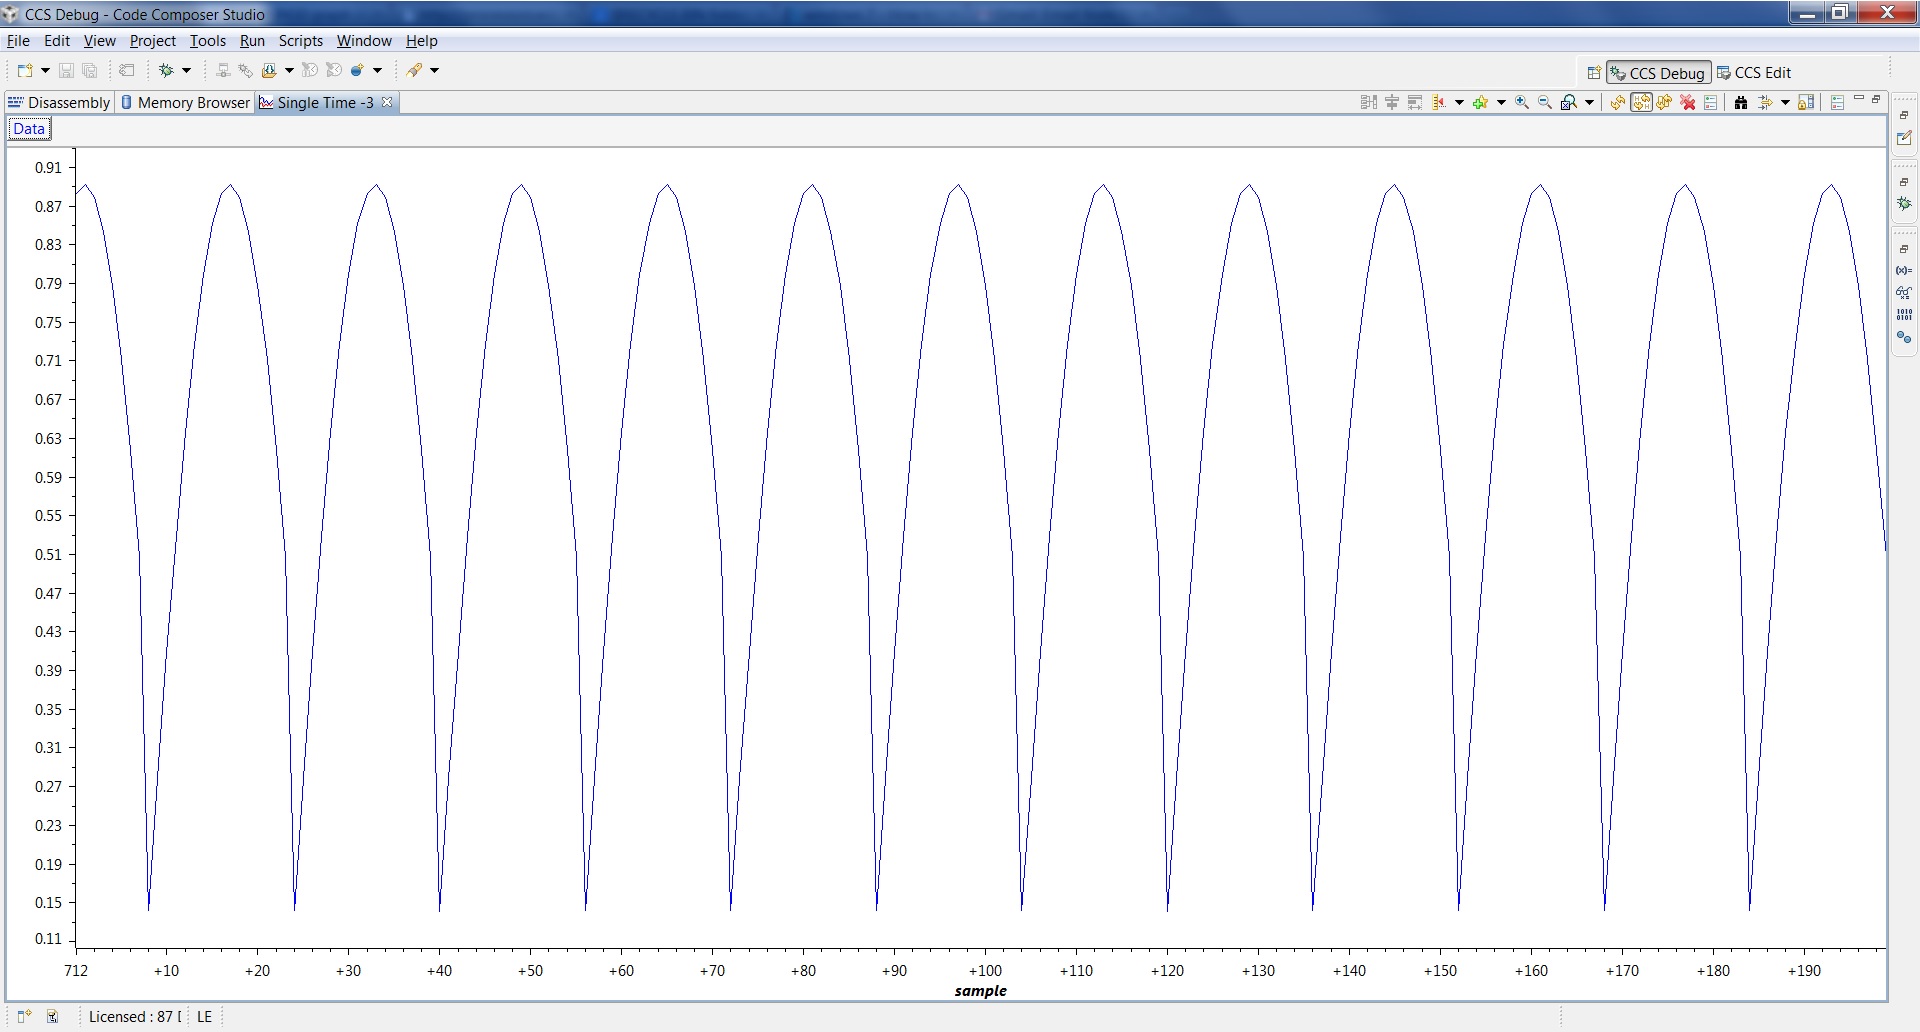
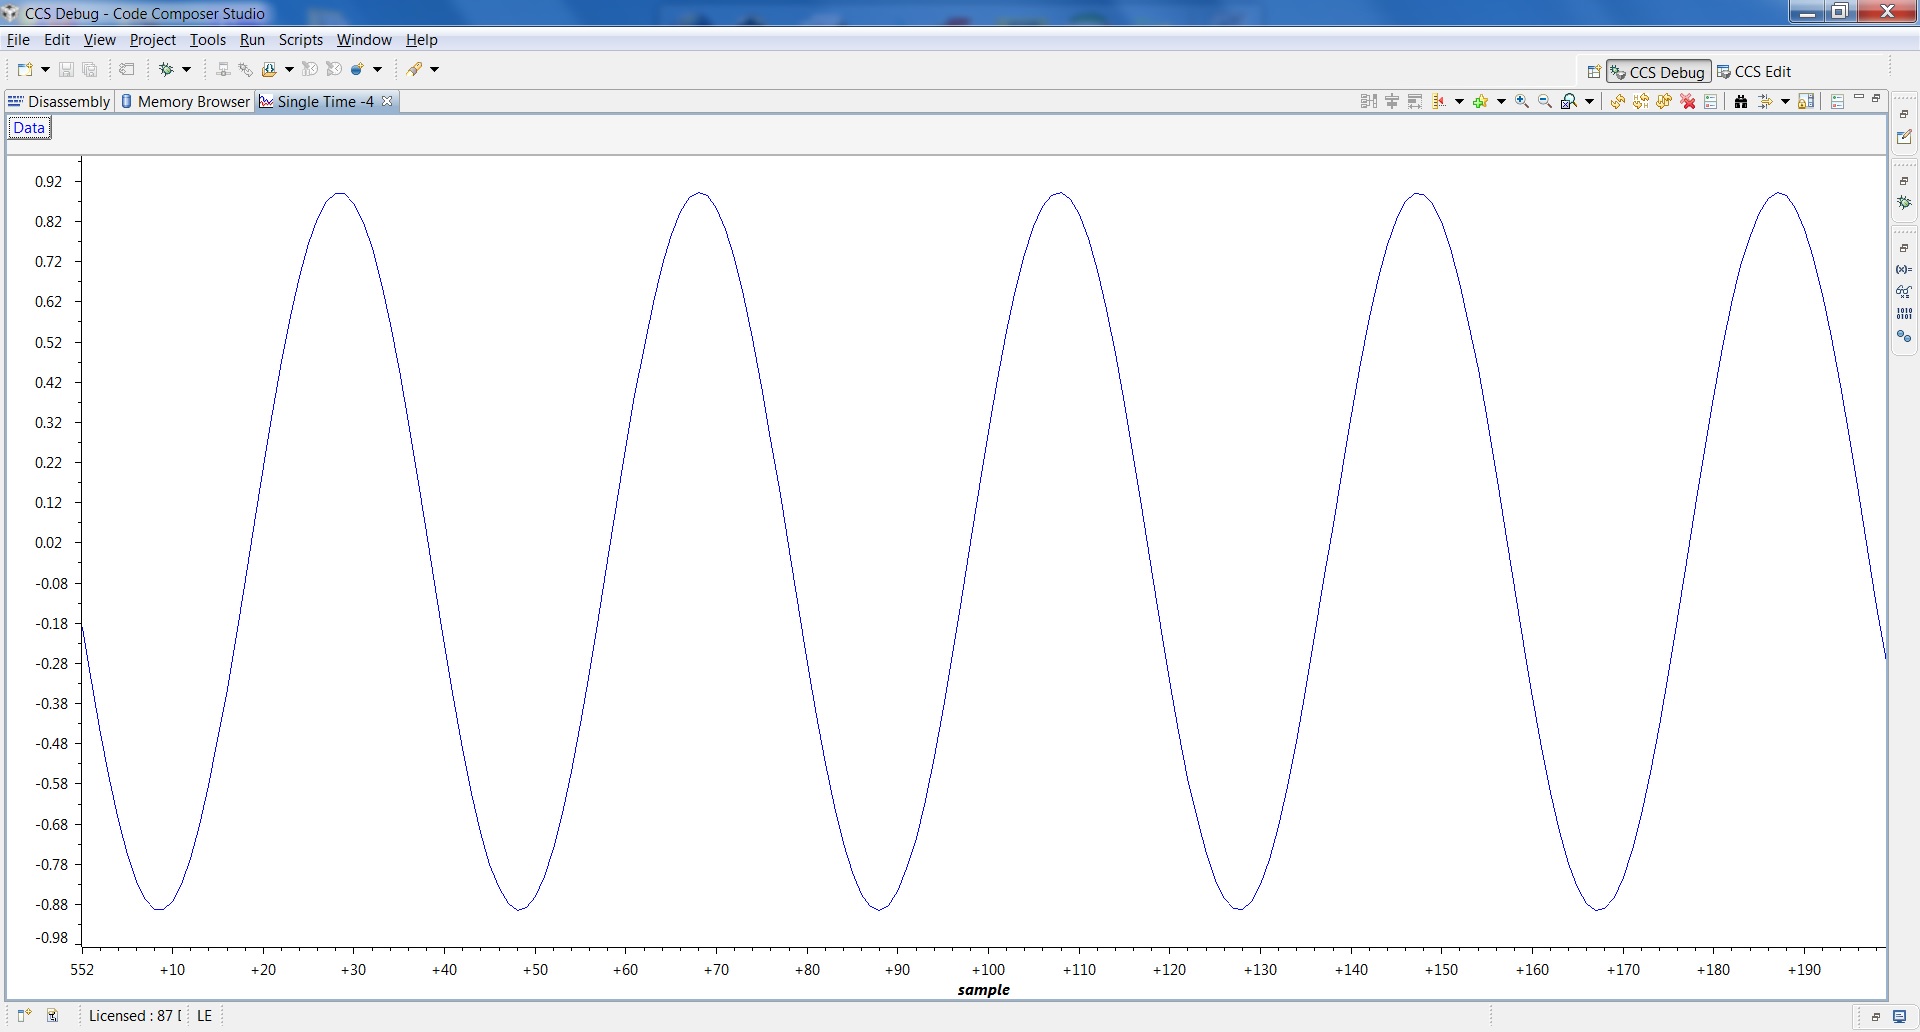
However while displaying the graph,  i am not getting the exact output as shown on the page. My sine wave looks like full wave rectified version of the ideal output.(Output is attached herewith)

What might have possibly gone wrong while debugging?

Also, it is given on the page as :  [5. Click on Target --> Run. The graph should update in batches of 16 samples.]. I am using the 'Resume(F8)' button on the debug toolbar. Am i doing it correct to Run?

Regards,

Dhiraj

  • Dhiraj,

    Your graph indicates the DSP Data Type may be set to 16-bit unsigned integer (where the graph would display only positive values)

    Are you using the exact same device as configured in the getting started guide? If not, the code itself may not be generating the negative values due to the bit sizes of the data types used (short, int, etc.) - although I would expect this would create a very distorted sinewave, and not a simple sign reversal.

    Hope this helps,

    Rafael

  • Hello Rafael,

    Thanks for reply on the same day itself!

     i have used the data type same as the given in the sample code without any changes. i had the similar doubt in the start about 'all postive values'. To probe into that i checked the nature of values y[3] array is taking. The variable y[n] is able to take the negative values as shown in the screenshot. The sinewave graph, its properties, typical values of the y[3] and the code are shown in the screenshots.

    In start, i had used C6713 Cycle Accurate simulator, little endian and later (before posting to forum) used C674X Cycle Accurate simulator, little endian (as given in guide). But problem is same with both of them.

    Please ask for any more details if you need on my part.

    Regards,

    Dhiraj

    sine.rar
  • Dhiraj,

    From the screenshots you sent I spotted something that may be impacting your display: the breakpoint should be at line 18 (inside the if ((counter % 16) == 15)) and not at line 19 (the closing curly braces). One of the possible reasons is that line 19 is reached at every interaction of the loop, while line 18 is only reached when the buffer is completely updated - the graph then displays all the 16 values of the output buffer with new and old values of the sine wave.

    Hope this helps,

    Rafael


  • Rafael,

    Thanks a lot!! This simple correction worked instantly!

    i apologies for the simple mistake i had made. Actually,i had put it at Line 18 only in the start as given in the guide. But may be i might have made some other mistake by then. i was mistakenly assuming that the buffer will be completely filled at line 19 and refreshed after execution of line 19. Hence, i had out it there.

    Thanks again!