Our group is discussing Debug vs. Release on the TiVA part using CCS5.4 and IT 5.0.5 build tool chain.
We are moving from an implementation that required a Release version because of JTAG pins conflicting with application pins. On all of our TiVa implementations that is not a limitation. All that differs between the build options are -g vs. --symdebug:none. I am linking to the same libraries, so their options should not matter. (Right?)
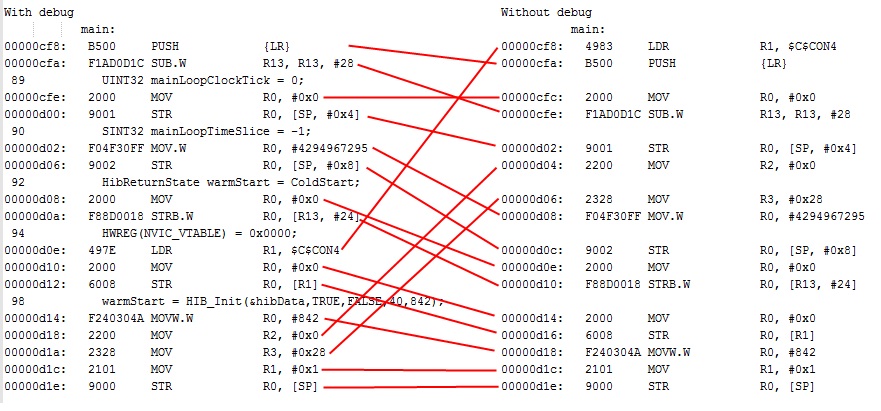
When I compare the hex files between the two builds, or the map files, there are huge differences. The map files seem to be telling me the FLASH sizes differ by almost 2KB.
I have seen this question broached for other targets. But those seemed to resolve as "different options".
We debug in simulation for many hours. The 'debug' configuration may end up on real HW for many hours. If we move to Release as a last step before sending to the field, are we setting ourselves up for obscure latent defects? The extra ~1KB of code has to be taking clock cycles for something.
My options are:
Compiler options:
-mv7M4
--code_state=16
--float_support=FPv4SPD16
--abi=eabi
-me
-g
--include_path="C:/ti/ccsv5/tools/compiler/arm_5.0.5/include"
--include_path="C:/Data/Code/LM4FCommon/CommonApp/trunk"
--include_path="C:/Data/Code/LM4FCommon/CommonLib/trunk"
--include_path="C:/Data/Code/TWM240005/CommonLibTWM240005/trunk"
--include_path="C:/ti/TivaWare_C_Series-1.0"
--define=ccs
--define=PART_LM4F232H5QC
--define=TARGET_IS_BLIZZARD_RA1
--define=DBG_SUPPORT
--diag_warning=225
--display_error_number
--gen_func_subsections=on
Linker options:
-mv7M4
--code_state=16
--float_support=FPv4SPD16
--abi=eabi
-me
-g
--define=ccs
--define=PART_LM4F232H5QC
--define=TARGET_IS_BLIZZARD_RA1
--define=DBG_SUPPORT
--diag_warning=225
--display_error_number
--gen_func_subsections=on
-z
--stack_size=2048
-m"RF2CAN.map"
--heap_size=0
-i"C:/ti/ccsv5/tools/compiler/arm_5.0.5/lib"
-i"C:/ti/ccsv5/tools/compiler/arm_5.0.5/include"
--reread_libs
--warn_sections
--display_error_number
--rom_model