This thread has been locked.

If you have a related question, please click the "Ask a related question" button in the top right corner. The newly created question will be automatically linked to this question.

How to approach Code Coverage on Library Assembly files

A couple of Code Coverage questions:

1)  How do I 'reset' or 'clear' code coverage results?   (i.e. the highlighted lines - oh, and not just turn them off or not display them - actually reset/clear them like no coverage has been gathered)

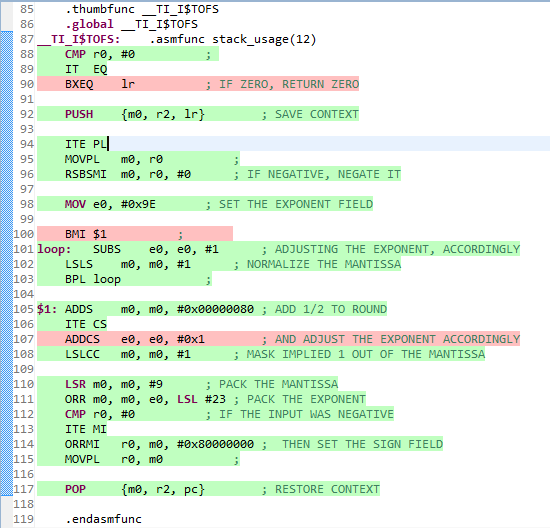
2)  I need to get Code Coverage results for a subset of the STD library, the files are assembly (e.g.  fd_add_t2.asm).  Currently, my approach is a project containing two files, main (which provides the input data to the assembly function, and the unit under test (UUT) assembly file (basically, its a harness/wrapper function which calls the assembly file).  I am used a similar approach found in a 2004 document (SPRA868A).  I seem to be getting some results but wanted to touch base with the forums and ping anyone who may have some pointers.


Thanks,

Steve


  • Actually I resolved the issue on my own.

    If you are having the same issue - simply do the following:

    1) Turn off the "Highlight coverage info in editor" button in the Functional Coverage View

    2) Terminate the Debug session (Terminating before Step 1 disables the option to clear the highlighting)

    3) Make any changes necessary (or in my case an input file) and restart a Debug session

    4) Hit the Activate button in the Profiler Setup View and your ready to Execute

    I am going to mark this as closed, but if anyone has additional methods please feel free to post them.


    Thanks,

    Steve