This thread has been locked.

If you have a related question, please click the "Ask a related question" button in the top right corner. The newly created question will be automatically linked to this question.

Profile Clock Count Difficulties

Other Parts Discussed in Thread: MSP430G2553

After looking around, I couldn't find any problems that matched mine so i'm here looking for all possible help that can be provided.

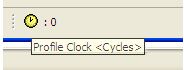
I am using the msp430G2553/lanchpad kit and am having some troubles with the profile clock in Code Composer Studio.  I am using the kit as a part of my introduction to micro controllers class and several times during class my professor has demonstrated how you can count the msp430's clock cycles using the profile clock in CCS.  However after some testing of my own, any single instruction step results in my clock reading about 68000 cycles.

So far I've tried different project set up settings, another lanchpad/chip, and even did a full re-install of CCSv5.  Each time I receive the same clock result.  Any suggestions will be greatly appreciated.

Thanks,

Kyle

  • Hi Kyle,

    While using profile clock, at first it will surely show you some garbage value. Later by using step by step debug mode you can check the actual clock cycles consumed. Else, you can reset the clock at first and then press the play button for a complete run.

    Regards,

    Gautam

  • I am not exactly sure what you mean...  Or maybe i did a poor job of explaining it in my initial post.  

    When I have a value of 0 cycles counted on the clock (either after a program start or after resetting the count by double clicking) and my next assembly instruction step taken (in the debugger view) results in a count around 68,000 cycles.  My instructor will take the same assembly language step in the same program loaded onto his computer, and the clock will be set to something much lower (2 cycles or so).

    I hope this is more clear.  Thanks again for the help

    -Kyle

  • Hi Kyle,

    could you possibly provide the example/steps?   Are you using the exact same steps/settings/code/debugger?

    Best Regards,
    Lisa 

  • Hello Lisa, 

    Thanks for responding.   As for the steps used, it hasn't made a difference in the instruction called, all instructions (i.e. mov.w, add.b, loop: jmp loop, etc)  return a large cycle count.  Also I've made countless different test projects with different settings and even imported one of my instructors own projects that worked fine with the profile clock for him.  As for debugger, I've only used the default one which came with CCSv5...

    I think it would work best with a screen cast example of my problem? I'll post a link to a demonstration video of the problem if that's allowed! 

    Thanks again,

    -Kyle

  • https://osu.box.com/s/7gcjqaebjc2mty93o3k1

    Hopefully this video will give you a better idea of whats going on, if its too blurry i might be able to do another export and upload in a higher resolution...

    Thanks 

    -Kyle

  • Kyle Edwards1 said:
    When I have a value of 0 cycles counted on the clock (either after a program start or after resetting the count by double clicking) and my next assembly instruction step taken (in the debugger view) results in a count around 68,000 cycles.  My instructor will take the same assembly language step in the same program loaded onto his computer, and the clock will be set to something much lower (2 cycles or so).

    Are you and your instructor using the same version of CCS 5?

    The thread Troubles to measure CPU clocks in CCS 5.5 suggests cycle counting returns incorrect results for MSP430G series devices in CCS 5.5, which was working in CCS 5.4.

  • Chester Gillon said:
    The thread Troubles to measure CPU clocks in CCS 5.5 suggests cycle counting returns incorrect results for MSP430G series devices in CCS 5.5, which was working in CCS 5.4.

    The following program can be used to demonstrate the failure using a MSP430G2553 in a MSP-EXP430G2 Launchpad:

    #include <msp430.h> 
    
    /*
     * main.c
     */
    int main(void) {
        WDTCTL = WDTPW | WDTHOLD;	// Stop watchdog timer
    
        __delay_cycles (10);
        __delay_cycles (20);
        __delay_cycles (30);
        __delay_cycles (40);
        __delay_cycles (50);
        __delay_cycles (60);
    	
    	return 0;
    }
    

    When the clock is enabled to count CPU Cycles at the start of main, and then step until the return CCS 5.4.0.00091 reports the correct elapsed cycle count of 216.

    However, CCS 5.5.0.00077 reports the incorrect elapsed cycle count of 8,585,432.

    CCS 5.4 was using MSP430.dll v3.3.1.3, and CCS 5.5 was using the later MSP430.dll v3.3.1.4. As an experiment made CCS 5.4 use the later MSP430.dll v3.3.1.4. CCS 5.4 still produced the correct cycle count which suggests the problem is in CCS 5.5 rather than the MSP430.dll

  • Wow, very useful, thanks for the help.  I am glad i'm not alone in this

    I suppose I should download 5.4 until the bug is fixed, thanks again,

    -Kyle