


Hello,
I have a problem using the System Analyzer tools. I configure my code composer studio project to works with UIA, and I instrumented my function as explained here :
http://processors.wiki.ti.com/index.php/SystemAnalyzerTutorial1F
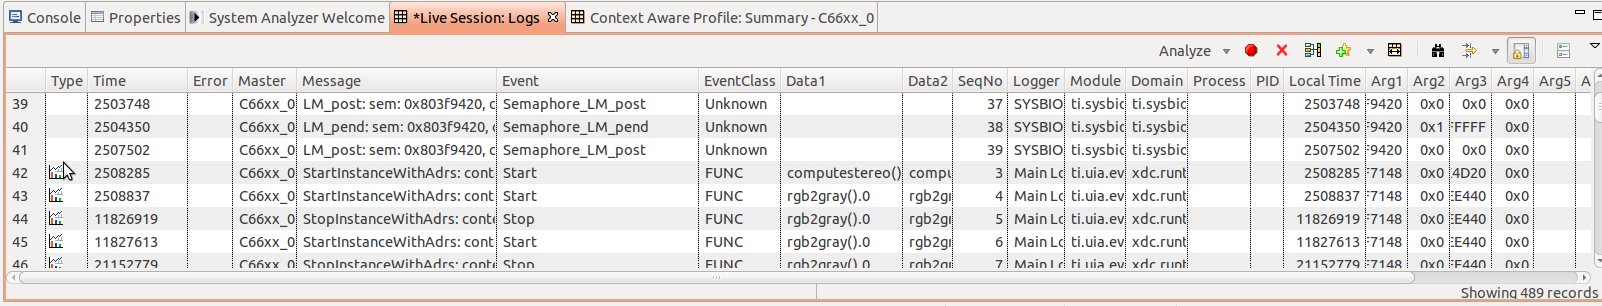
I can see in the "Live Session Logs" windows all the logs generated when entering and exiting function (see bellow), but nothing is displayed in the "context aware profile" windows (0 record).
For instrumentation I use recommended functions :
void functionEntryHook( void (*addr)() ){
    Log_write3(UIABenchmark_startInstanceWithAdrs, (IArg)"context=0x%x, fnAdrs=0x%x:",(IArg)0, (IArg)addr);
}

void functionExitHook( void (*addr)() ){
    Log_write3(UIABenchmark_stopInstanceWithAdrs,  (IArg)"context=0x%x, fnAdrs=0x%x:",(IArg)0, (IArg)addr);
}
I also tried several other functions for entry/exit hooks. I think my project configuration is correct because I am able to see the generated log, the functions addresses are well decoded, so my debugging symbols are well configured too.
I use a C6678 EVM REV3.B with the internal USB Debugger. My code composer studio version is 5.3.0. I am on a linux operating system.
Regards,
