This thread has been locked.

If you have a related question, please click the "Ask a related question" button in the top right corner. The newly created question will be automatically linked to this question.

CC Studio Debugger not following PC register

Other Parts Discussed in Thread: AM3359

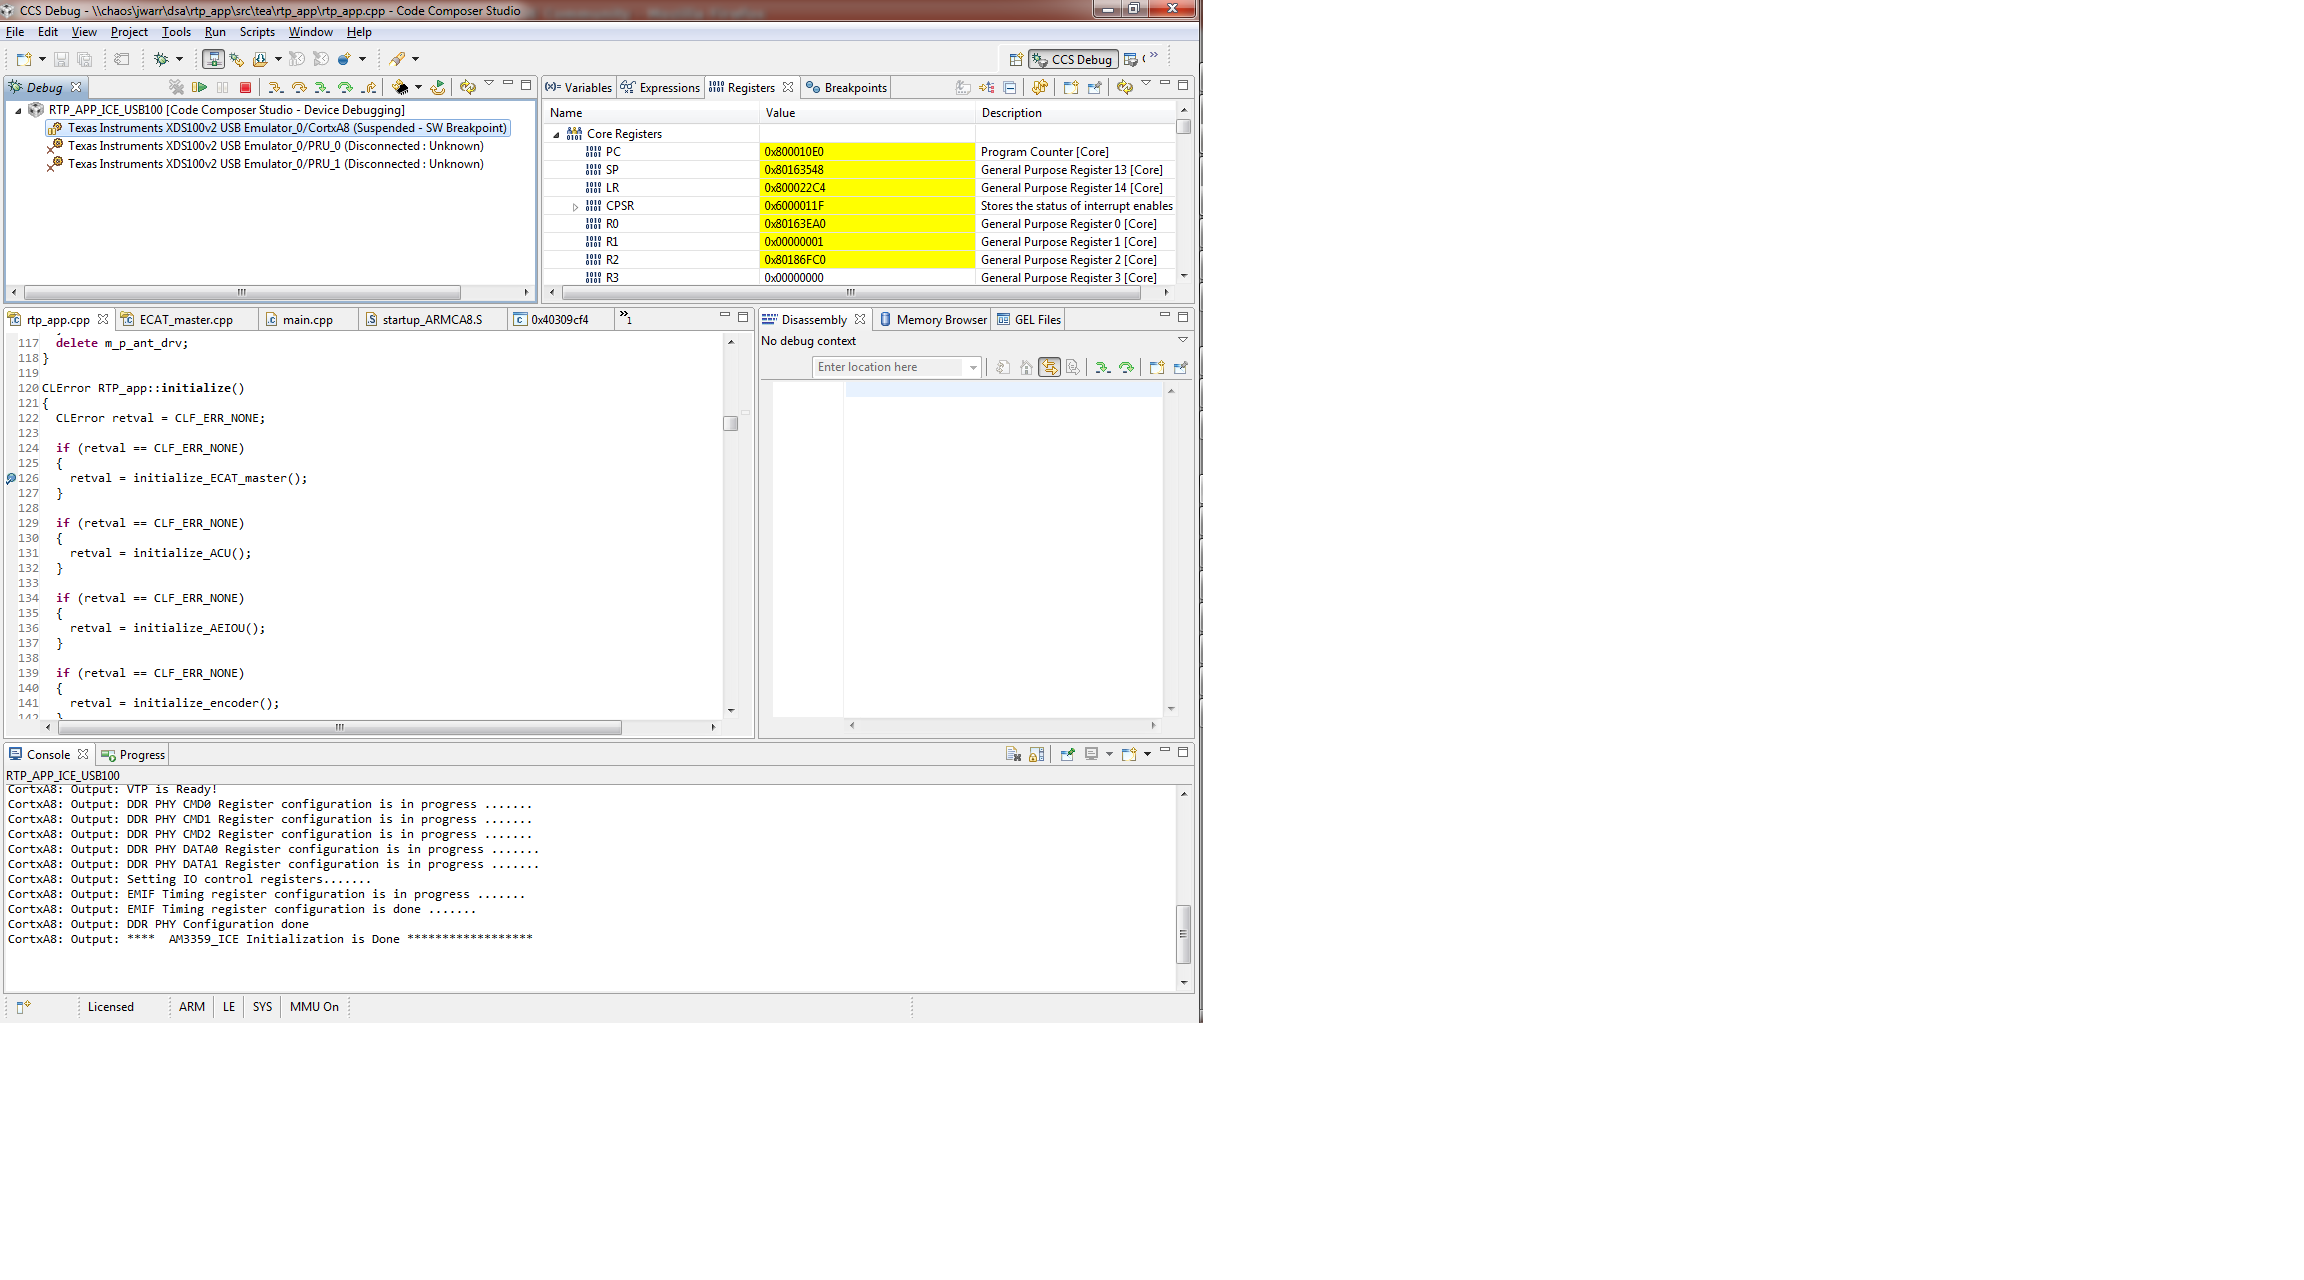
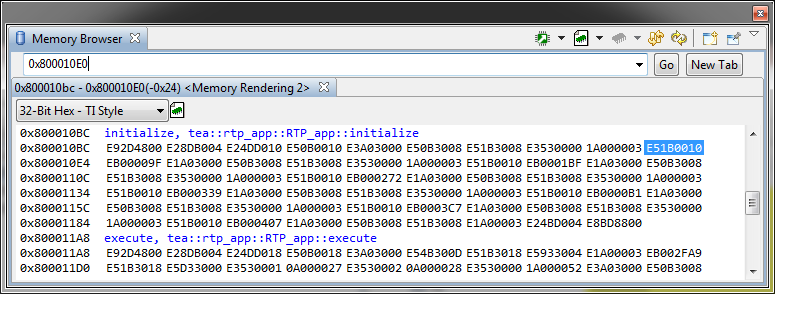
I am seeing the debugger not seem to follow the execution of the processor in the source and disassembly windows.  I can load my application, and it will run and stop at the entry to main.  If I set a breakpoint in my application and then resume execution, the processor appears to execute until it hits my breakpoint.  The red line that indicates my breakpoint has been hit appears, and the PC register shows the address of my breakpoint.  However, the arrow that normally points to the current source line of execution is not there, and the disassembly window becomes nonresponsive.  I can step instructions, and the PC register updates.  But no arrow appears, and the disassembly window remains nonresponsive.  Clicking the "Go to Program Counter" button in the disassembly window has no effect.

What could cause the debugger to not get out of sync with the Program Counter?

I am using CC Studio 5.5.0.0077 on 64-bit Windows 7.  My target is a custom board with an AM3359.  I am using a Blackhawk XDS560v2 System Trace emulator.  I have compiled my application with the TI-provided gcc compiler.

Thanks

--Josh

  • Hi Josh,

    Josh Warr said:
    f I set a breakpoint in my application and then resume execution, the processor appears to execute until it hits my breakpoint. 

    How are you setting this breakpoint? In the editor or via the Breakpoints view?

    Josh Warr said:
    The red line that indicates my breakpoint has been hit appears, and the PC register shows the address of my breakpoint.  However, the arrow that normally points to the current source line of execution is not there, and the disassembly window becomes nonresponsive

    Could you provide some screenshots? Especially of the disssembly window.

    Thanks

    ki

  • I set the breakpoint in the editor by double-clicking in the gutter.  It is a "Code Composer Studio Breakpoint:"

    I have tried changing the type to a C/C++ Breakpoint as well as a hardware breakpoint, and the behavior is the same.

    Here it is after I have hit a breakpoint.  The Program Counter has updated, although this time there is no red line by the breakpoint.  In the past the red line has been there.  But the disassembly window is empty, and the arrow pointing to the current source line is missing:

    The memory window works at this time.  Displaying near where the PC register says:

    So the PC looks right--it's near the beginning of the initialize().

  • Josh,

    It looks like the callstack is failing to unwind.  There are a few cases in 5.5 where when that happens, no event is fired and thus most eclipse windows that wait for the callstack remain unresponsive.  That issue has been addressed in 6.0 - an event is always fired and it will include the error that caused the unwind to fail.

    You can download beta 4 of CCS 6 here: http://processors.wiki.ti.com/index.php/Category:Code_Composer_Studio_v6.  I would recommend trying as it should work, and it should also indicate next to the callstack what the error was that was causing the issue in 5.5.

    Darian

  • I am currently trying to download v6 but running into problems (the online installer fails, and the offline installer won't download).  It's possible the problem is on my end with firewall-type issues--I will chase that separately.

    In the meantime, perhaps you could provide some more information that would help me diagnose the problem with debugging my application.  What are the cases in 5.5 where the callstack fails to unwind?

    Thanks

    --Josh

  • Josh - we are having some issues with our server today. Hopefully it will be straightened out soon.

  • I was able to install CCSv6.  The problem does not occur with CCSv6.  The debugger stops at the breakpoints, the arrow appears, the disassembly window populates, and I can step as expected. 

    I just tried again with CCSv5.  Same board, same JTAG emulator, same application, same target configuration file, debug configuration set up the same way, and breakpoints set in the same places.  CCSv5 has the problem, CCSv6 does not.

    Where do I go from here?  My company does not have licenses for CCSv6.

    Thanks

    --Josh

  • Josh you can use the attached license file with v6 until the end of June.

    4885.CCSv6-Eval-License-Jun30-2014.zip

    Depending on when your company purchased CCSv5 you may be entitled to an upgrade to v6.  If you go to www.ti.com/myregisteredsoftware it will show you what your subscription status is.  If it is not expired then you will get a notification when v6 comes out with instructions on how to upgrade your v5 license to v6.  

    John

  • But v5 is still supported, right?  So will there be a fix for this issue in a later version of v5?

  • The type of support changes.  We still answer questions.  Updates to the "bits" that end up in your application are still regularly released (compiler, RTOS, Ware...).  However in general service releases for the IDE/Debugger stop.  There are exceptions where we will push out a service release if there are some production stop issues that need to be addressed.

    Has your subscription expired?