This thread has been locked.

If you have a related question, please click the "Ask a related question" button in the top right corner. The newly created question will be automatically linked to this question.

CCS V6.0 Debugger issue

Other Parts Discussed in Thread: CCSTUDIO

 CCStudio ver 6.0.0. ...190

 Install platform Linux Mint 16 Olivia 64Bit (on a sony vaio SVS1511C5E 8 gB ram, I7 quad core)

 Target platform TIVA C123 and C129 too (behave same)

 When code stop at a breakpoint stepping and stepping into remain locked to breakpoint location, it is necessary to disable , do a single step then reenable.

 Clearing breakpoint for complete removal result still stopping code at previous BP location. After reloading code threat disappear.

 Reset and reset core are not functioning, sometimes they leave the processor in a broken status, the only way to exit FROM HANG is to do a core reset then a reset. if sequence is not in this order it fail or never step code. This particularly on C129 series, 123 series suffer less.

  • Hi,

    I can't reproduce this in my system, although I am using Ubuntu 12.04/64 on my TM4C123 Launchpad.

    Given the Operating systems are very similar, I imagine the step operation is failing due to some other problem. Can you try to follow the steps shown in the Debugger and General IDE sections of the CCSv6 Troubleshooting page? These tips help overcome some unexpected behavior such as yours.

    Apart from what you provided, is there anything else that you imagine could possibly be influencing this behavior? Things such as a high number of breakpoints (HW breakpoints are limited), if it only happens in specific sections of the code (interrupts, initialization code, etc.), if it only happens with specific projects, if the device running in real-time mode (interrupts still run if the device is halted), what emulators you are using (I am using the Launchpad's embedded emulator), etc. These could help bring some additional insights to the problem.

    Hope this helps,

    Rafael

  •  Hi Rafael, one more issue on support, file is set to stdout, when I enable logging no way to set filename, using browse don't select directory but search for a file. I created qs.log empty file than I set that to logging.

     All from project is included and you can find log file on first level, this is untouched qs_rgb imported from example, loaded to launchpad tm4c123gxl then run to breakpoint trace remain stuck at, disable trace reenable and trace run smooth.

     Clear all breakpoint reset then run stop again to where breakpoint is, trace step regular.

     On DK-TM4C129x this issue was on a task of TIRTOS, code was nothing special just a keyboard scan running from a timer, the issue is the same reproduced here, one breakpoint.

     I wait your next instruction to dig on where this issue can come from.

     2541.qs-rgb.zip

  • Roberto,

    Roberto Romano said:
    file is set to stdout, when I enable logging no way to set filename, using browse don't select directory but search for a file. I created qs.log empty file than I set that to logging.

    I see this issue with the Debug Server log commands. I will file a bug about it.

    Roberto Romano said:

    loaded to launchpad tm4c123gxl then run to breakpoint trace remain stuck at, disable trace reenable and trace run smooth.

     Clear all breakpoint reset then run stop again to where breakpoint is, trace step regular.

    Thank you for sending the project.

    I loaded the code to my TM4C123GXL Launchpad and, if I understood correctly your procedure, I set a breakpoint at a specific location in the code (I set one at line 670 of the <qs-rgb.c> file). Then I ran my code and it halted at that location (which is expected). I then put the code to run (F8 key) a few more times and it always halted at that location (also an expected behaviour). Then I removed the breakpoint and put it to run again (F8 key). The code did not halt this time - it ran free.

    I also did a single step when it reached the breakpoint. It worked fine - i.e., it ran to the next line without having to disable/delete the breakpoint.

    That is what I think we are seeing different behaviour, is that so? In your case the code is halting all the time even when the breakpoint is cleared or disabled, right?

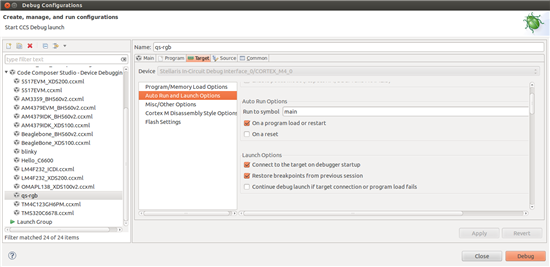
    One detail I just thought about it is that you can try to change the Debug Configuration settings in CCS. Terminate the debug session then go to menu Run --> Debug configurations --> select the qs-rgb configuration on the tree on the left and un-check the option Restore breakpoints from previous session as shown below:

    Apart from this, I am unsure on what else to suggest, apart from the Troubleshooting page I sent before (create a new workspace, erase the previous debug configuration settings, erase the temporary files, etc).

    Regards,

    Rafael

  • Hi,

    desouza said:
    I see this issue with the Debug Server log commands. I will file a bug about it.

    I filed today bug number SDSCM00050230. You can check its status in the link SDOWP in my signature below.

    Regards,

    Rafael

  • desouza said:
    I loaded the code to my TM4C123GXL Launchpad and, if I understood correctly your procedure, I set a breakpoint at a specific location in the code (I set one at line 670 of the <qs-rgb.c> file). Then I ran my code and it halted at that location (which is expected). I then put the code to run (F8 key) a few more times and it always halted at that location (also an expected behaviour). Then I removed the breakpoint and put it to run again (F8 key). The code did not halt this time - it ran free.

     Hi Rafael, did you see qs.log in project folder?

    Setting a breakpoint then run code execution stop at BP, single step stop here forever!

    disabling BP I can spep regularly. Reenabling this break point code stop regularly and stuck at..

     Removing all breackpoint run stop again where BP it was...

     Reloading Debug session BP is no more active and code run smooth.